 Image via Wikipedia
 Image via Wikipedia
 Image via Wikipedia
PETA gets destroyed in an interview - YouTube | |
www.youtube.com/watch?v=7udB_qqgav026 Feb 2010 - 3 min - Uploaded by xyberfunk Public Records: PETA Found Adoptive Homes for Less than 1 out of 300 ... But from a cost-saving standpoint ... | |

More videos for PETA hypocrisy »
http://www.wvec.com/home/PETAs-euthanasia-rates-highest-in-Hampton-Roads-125837098.html
http://www.virginia.gov/vdacs_ar/cgi-bin/Vdacs_search.cgi?link_select=facility&form=fac_select&fac_num=157&year=2010
http://www.youtube.com/watch?v=4cCl4N4fnt0&feature=fvwrel
........................................................................................................................
Comments accompanying submitted news article were killed at Care2 -
Judith Curry
On the Credibility of Climate Research Part II : Rebuilding ...
"Shortcut the research somewhat - and let me know if you have more to add http://

"Related story on media fraud hyping alarmism Nor is this the first time the BBC has been accused of such http://
"I rather wonder at the level of reading skills involved in 'Judith Curry' opens mouth , inserts foot. ' Point blank : "There is no scientific basis for saying that warming hasn’t stopped." means 'ther..."
( and that should be 'there is no scientific basis for saying change has stopped' )
http://tamino.wordpress.com/2011/10/30/judith-curry-opens-mouth-inserts-foot/
http://greenfyre.wordpress.com/2011/04/23/judith-currys-disingenuous-blame-game/
The EnvironmentaList
Nov 18
Local Food, meet Local Legislation
While Congress Cooks Up a Secret Farm Bill, Some Towns Get Creative in Supporting Small-Scale Agriculture
Nov 17
Farmageddon Uncovers Government’s Insane Campaign Against Small Farmers
New Documentary Film Examines Attack on Raw Milk Producers, Ranchers
Nov 16
Nov 15
PETA Lawsuit Might Force Us to Rethink our Relationship with Animals
“Orca Slavery” Case Against SeaWorld Questions Our Authority to Treat Other Living Beings As Property
Nov 14
Hunters Have Killed More than 180 Wolves in the Northern Rockies
Without Federal Protection, Bloodbath is Underway
Nov 10
Lies, Damned Lies, and the Public Relations Industry
In an Age of Information Warfare, We Must All be Forensic Scientists and Rhetoricians
We Must all be Forensic Scientists and Rhetoricians
Information Warfare Pits Corporations Against Environmentalists
Nov 09
Big Art Project on Climate Change and Displacement Muddies the Message
Artist Uses Rocks Extracted From Virgin Arctic Island
Nov 07
UK Activists Tell Energy Companies to Frack Off
Drilling Requests are Multiplying, but so are Anti-Fracking Campaigns
Nov 04
An In-Depth Look at the New Face of the Automobile Industry
Review: Revenge of the Electric Car (Documentary)
JoNova: Science, carbon, climate...
Nov 17
IPCC scientists test the Exit doors
RE: Mixed messages on climate ‘vulnerability’. Richard Black, BBC. AND UPDATED: The Australian reports the leaked IPCC review, AND a radio station just announced it as “IPCC says we don’t know if there is a reason for the carbon tax”. See more below. ———————————- ... This is another big tipping point on the slide out of the Great Global Scam. IPCC scientists — facing the travesty of predictions-go
Nov 16
The Age does award winning PR — oops was that meant to be science?
RE: “Sceptic: one inclined to doubt accepted opinions” by Michael Bachelard, The Sunday Age ———————————– For free, and just because I’m a nice person, I’m going to help Michael Bachelard with his science articles. He’s a Walkley Award winner writing for the two largest “broadsheet” circulation papers in Australia. He knows indigenous issues, politics and industrial relations, so “climate science”
Nov 13
The chemistry of ocean pH and “acidification”
The ocean acidification threat is a big can of worms. I asked Professor Brice Bosnich to help create a quick reference page on the chemistry and was pleased he could find the time to help. Here’s everything you wanted to know about the basics… He explains what pH means, and points out that: Ocean pH varies by 0.3 naturally. Claims of acidification since 1750 are based on dubious models and few obs
Unthreaded November 14 2011
For all those other topics…. Rating: 8.0/10 (5 votes cast)Rating: 8.0/10 (5 votes cast)
Nov 11
Naomi Klein’s crippling problem with numbers
Naomi Klein Photo: Mariusz Kubik Naomi Klein was the wrong person to send to a heavy-weight science conference — in “Capitalism vs Climate” she notices hundreds of details, but they’re all the wrong ones. Naomi can tell you the colour of the speakers hair, what row they sat in, and the expression on their face — it adds such an authentic flavor to the words, but she’s blind to the details that co
Nov 10
Big-Oil money fund warmists, confusing attack machine
Pew Charitable Trusts is an influential “progressive” think-tank with $5 billion in assets. What was the The Pew Center on Global Climate Change has lost the Pew name and funds, and become the Center for Climate and Energy Solutions (C2ES). Pew used to supply $3.5 million of the center’s current $4.4 million annual budget. Instead, in complete green purity, Royal Dutch Shell PLC, Hewlett-Packard C
Nov 08
Welcome to a “Hung” Democracy
And so it came to pass that a small band of the selfish or deluded came to steal the blood, sweat and toil of the many. They lied, broke solemn promises, failed to provide evidence, and displayed a singular lack of good-manners. They viciously insulted anyone who disagreed, they hid the models the public were forced to pay for, they gave patrons highly paid jobs to advertize their scheme. They spe
Nov 07
Labor Party Big Economics Idea: Pay $10 billion to *lose* $20 billion more!
This is about what it adds up too: If the carbon tax costs us, say, $10 billion a year (anyone have a better number?) we not only have to pay that, but we might lose another $20 billion a year as well. As I’ve said before, you can’t compensate the nation. There is no productivity gain, no win, no efficiency improvement. There is no bigger pie if you have to cook with leather. Treasury likes to pre
Nov 06
One day to go before Australia wins Global Hair Shirt
Australia will — bar asteroid impact — get its Carbon Tax on Tuesday. Otherwise, it’s business as usual in skeptic-world: Wild unheard-of snow started falling early in the US; there’s another story about masses of fossil fuel energy somewhere under Australia, another western nation makes it stark raving clear that it won’t be getting an ETS (Yay for Canada eh), while a different one pulls the pin
Nov 03
CO2 emitted by the poor nations and absorbed by the rich. Oh the irony.
Kudos to John O’Sullivan for finding this story; see the note at the end about the extraordinary response his post on this received. ———————————- Who are the world’s worst “polluters”? According to a new high-spectral-resolution Japanese satellite — it’s developing countries. Who knew detailed spectroscopic data on Earth’s atmosphere was available to figure out where the CO2 and other greenhouse g
Roy Spencer, Ph. D.

Latest
Oct 12
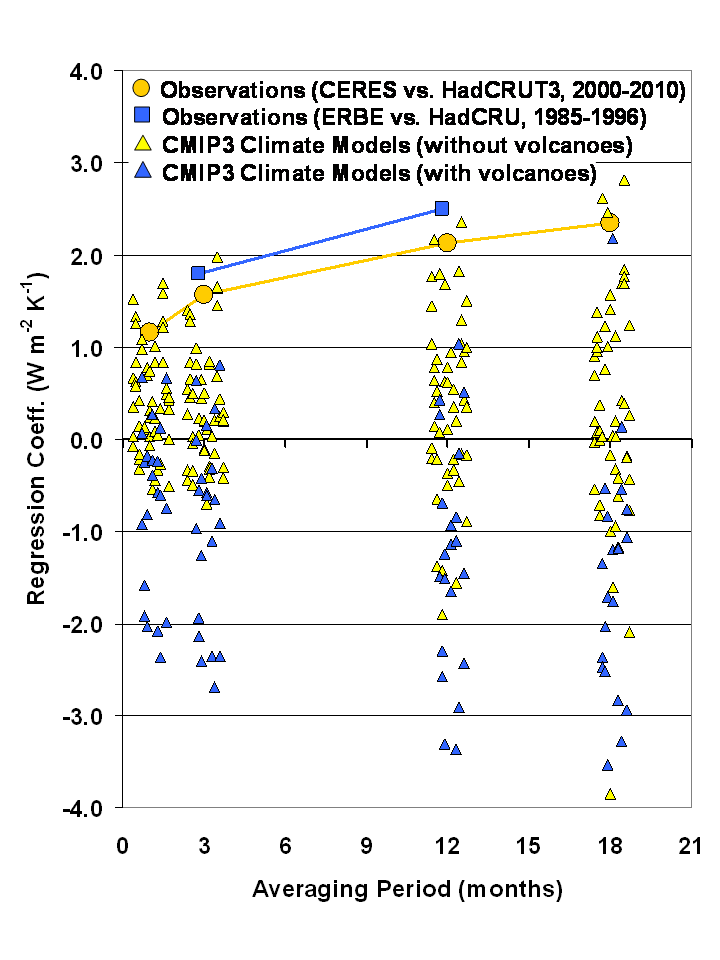
Our GRL Response to Dessler Takes Shape, and the Evidence Keeps Mounting
I will be revealing some of the evidence we will be submitting to Geophysical Research Letters (GRL) in response to Dessler’s paper claiming to refute our view of the forcing role of clouds in the climate system. To whet your appetite, here is a draft version of one of the illustrations (click for the large version). It clearly shows the large discrepancy which exists between the IPCC climate mod
Oct 08
I’ve Looked at Clouds from Both Sides Now -and Before
…sometimes, the most powerful evidence is right in front of your face….. I never dreamed that anyone would dispute the claim that cloud changes can cause “cloud radiative forcing” of the climate system, in addition to their role as responding to surface temperature changes (“cloud radiative feedback”). (NOTE: “Cloud radiative forcing” traditionally has multiple meanings. Caveat emptor.) But that’s
Oct 04
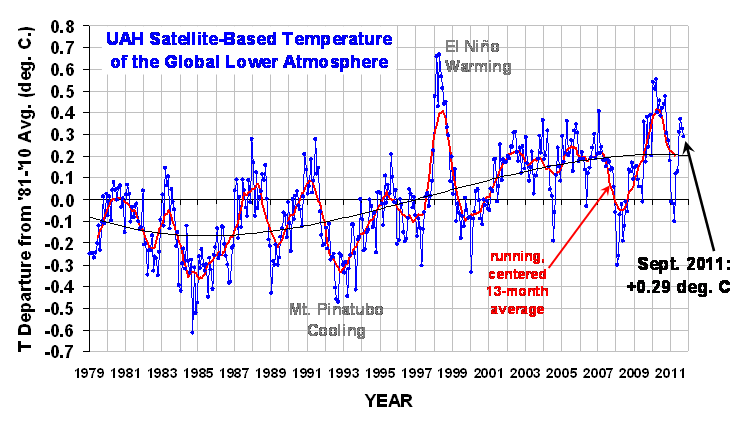
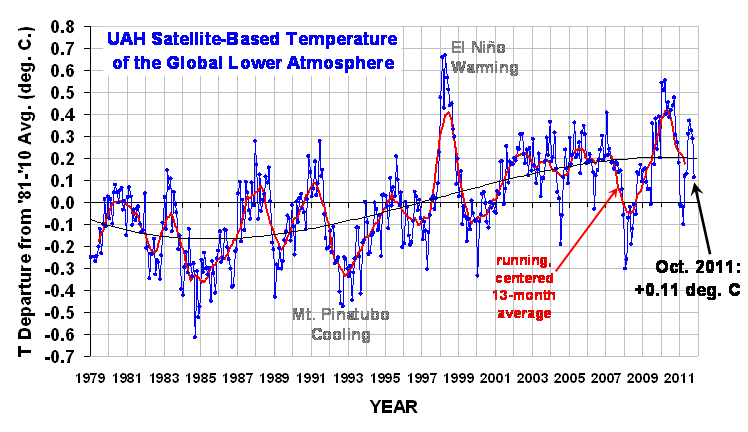
UAH Global Temperature Update for September 2011: +0.29 deg. C
The global average lower tropospheric temperature anomaly for September, 2011 retreated a little again, to +0.29 deg. C (click on the image for the full-size version): The 3rd order polynomial fit to the data (courtesy of Excel) is for entertainment purposes only, and should not be construed as having any predictive value whatsoever. Here are this year’s monthly stats: YR MON GLOBAL NH
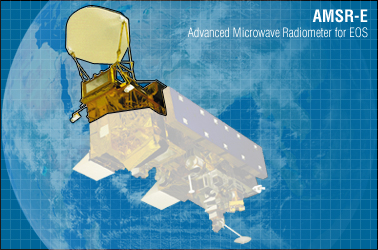
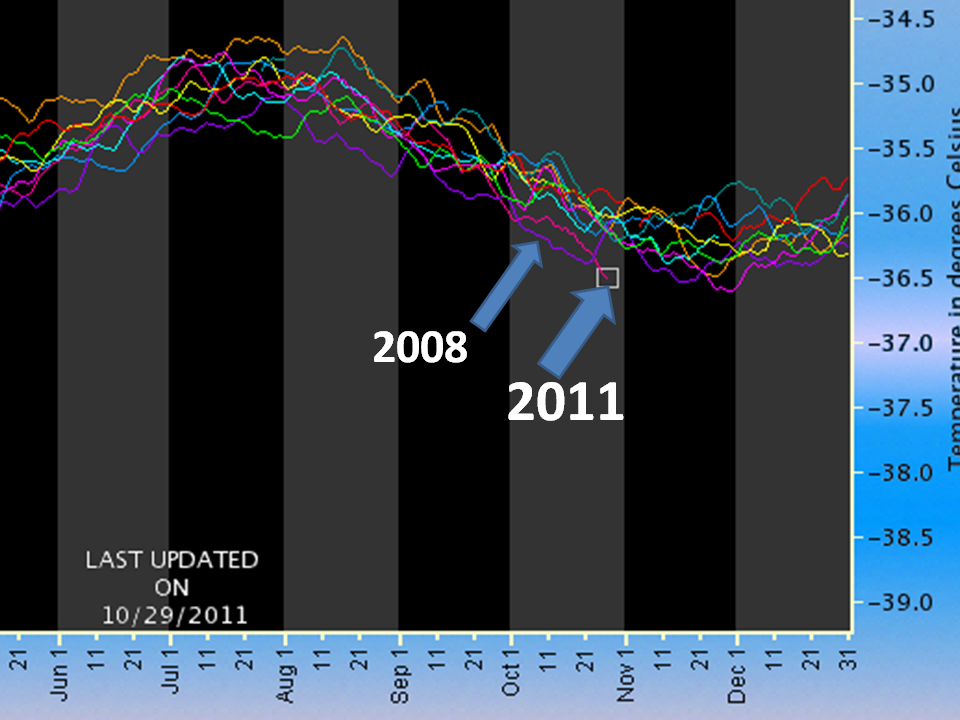
AMSR-E Ends 9+ Years of Global Observations
UPDATE #1: See update at end. The Advanced Microwave Scanning Radiometer for the Earth Observing System (AMSR-E) was automatically spun down to its designed 4 rpm safe condition last night after recent increases in the amount of power required to keep it spinning at its nominal 40 rpm were beginning to cause noticeable jitter in NASA’s Aqua satellite. The instrument has over 480 pounds of spinn
Sep 22
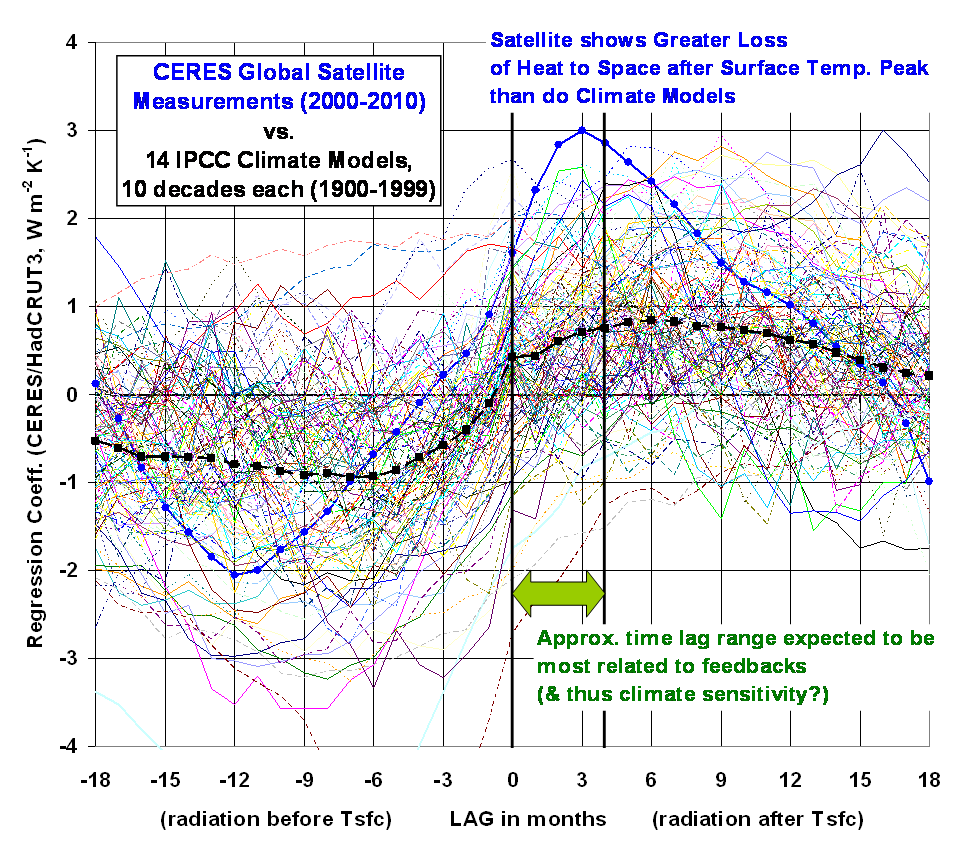
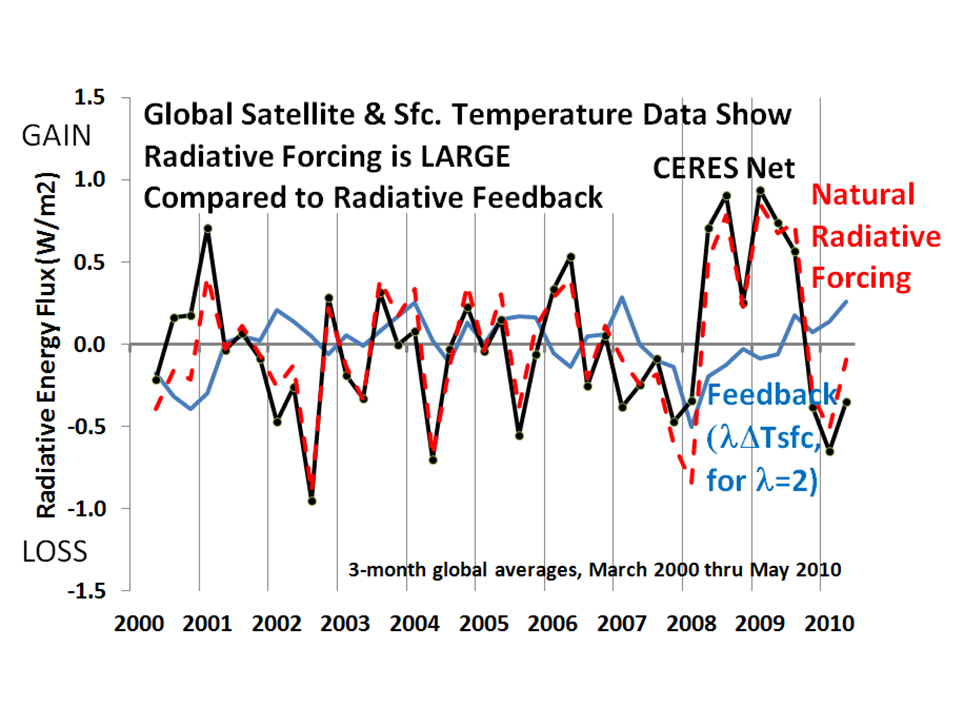
The Rest of the Cherries: 140 decades of Climate Models vs. Observations
Since one of the criticisms of our recent Remote Sensing paper was that we cherry-picked the climate models we chose to compare the satellite observations of climate variations to, here are all 140 10-year periods from all 14 climate models’ 20th Century runs we analyzed (click to see the full res. version): As you can see, the observations of the Earth (in blue, CERES radiative energy budget ve
Sep 14
An Open Letter of Encouragement to Dr. Dessler
Since I keep getting asked about the “latest” on the ongoing debate over clouds and feedback diagnosis between myself and Andy Dessler, I decided that this would be the best way to handle it under the current circumstances: An Open Letter of Encouragement to Dr. Dessler Dear Andy: Thank you for the issues you have raised in your new paper, which I was only recently made aware of after it had alre
Sep 05
Dessler vs. Rick Perry: Is the 2011 Texas Drought Evidence of Human-Caused Climate Change?
One of the most annoying things about the climate change debate is that any regional weather event is blamed on humans, if even only partly. Such unscientific claims cannot be supported by data — they are little more than ambiguous statements of faith. The current “exceptional” Texas drought is no exception. People seem to have short memories…especially if they were born after most of the major
More Thoughts on the War Being Waged Against Us
After having a day or so to digest some of what others have said about this whole mess, I’ve been trying to find better ways of expressing the science which is being disputed here. I’ve also gone back and tried to figure out exactly which part of our analysis was (supposedly) in error. A Re-Examination of our Paper So, first I went back and re-read our paper to find out what we did that was so se
Sep 03
A Primer on Our Claim that Clouds Cause Temperature Change
…and Why Dessler, Trenberth, and the IPCC are Wrong After the resignation of the Editor-in-Chief at Remote Sensing over the publication of our paper in that journal, I thought it would be good to summarize as simply as I can what the controversy is all about. [I am also including Trenberth in this discussion because there is a misperception that the paper by Trenberth et al. (2010), which only de
Sep 02
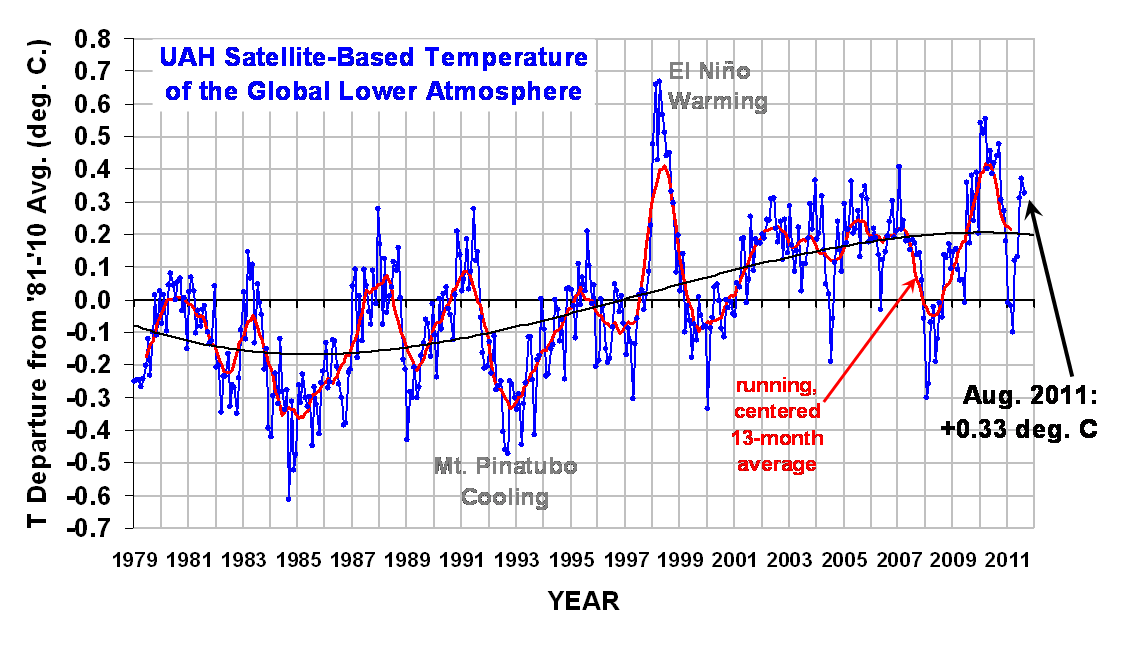
UAH Global Temperature Update for August, 2011: +0.33 deg. C
NOTE: Updated with tropical sea surface temperatures. The global average lower tropospheric temperature anomaly for August, 2011 retreated a little, to +0.33 deg. C (click on the image for a LARGE version): Note that this month I have taken the liberty of adding a 3rd order polynomial fit to the data (courtesy of Excel). This is for entertainment purposes only, and should not be construed as hav
Editor-in-Chief of Remote Sensing Resigns from Fallout Over Our Paper
[NOTE: the August, 2011 temperature update appears below this post.] SCORE: IPCC :1 Scientific Progress: 0 [also see updates at end of post] It has been brought to my attention that as a result of all the hoopla over our paper published in Remote Sensing recently, that the Editor-in-Chief, Wolfgang Wagner, has resigned. His editorial explaining his decision appears here. First, I want to state th
Aug 29
The Al Gore Show: 24 Hours of Denying Reality
Maybe the best way to summarize the main message of this post is this: There have been no weather events observed to date – including Hurricane Irene — which can be reasonably claimed to be outside the realm of natural climate variability. Now, you can believe – as Al Gore claims – that the present warm period we are experiencing has caused more hurricanes, more tornadoes, too much rain, too litt
Aug 22
O’Reilly, O’Bama, and the O’Conomy
..or, It’s Not About Money…It’s Our Standard of Living I just endured a rather inane discussion on the O’Reilly Factor with actor/pundit Wayne Rogers and economist/comedian/actor/pundit Ben Stein, over whether President Obama helps or hurts the economy. The debate quickly turned, as it often does, to whether it would help the economy to tax the rich more. What annoys me the most about such debates
Aug 14
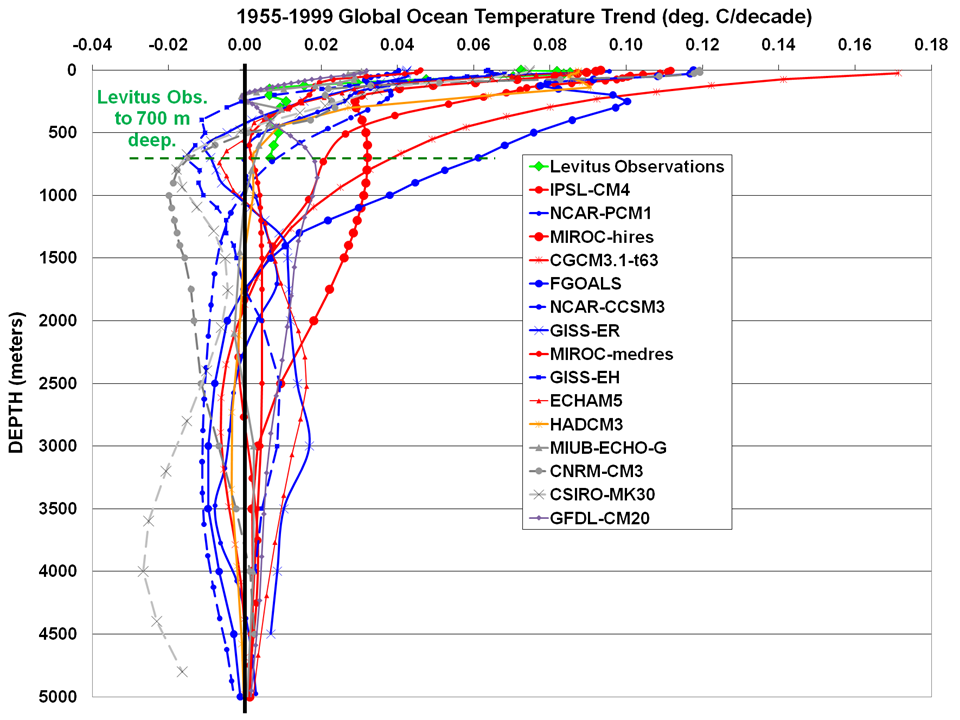
Deep Ocean Temperature Change Spaghetti: 15 Climate Models Versus Observations
The following comparison between the 20th Century runs from most (15) of the IPCC AR4 climate models, and Levitus observations of ocean warming during 1955-1999, further bolsters the case for a relatively low climate sensitivity: estimated here to be about 1.3 deg. C for a future doubling of atmospheric CO2. This is quite a bit lower than the IPCC’s best estimate of 3 deg. C warming. But the beha
Aug 07

Is Gore’s Missing Heat Really Hiding in the Deep Ocean?
NOTE: For those who are offended by my bringing up Al Gore in this post (but are apparently not offended by Gore falsely accusing scientists like me of being ‘global warming deniers’), I suggest you just focus on the evidence I present. You are invited to offer an alternative explanation for the evidence, but I will not allow you to divert attention from it through irrelevant “copy and paste” fac
Aug 05
A Step in the Right Direction: Backing off of Anthropocentrism in Climate Research
Yesterday’s press release from the UK Met Office introduces 2 new papers in Geophysical Research Letters which explain the recent lack of ocean warming, approximately since 2003. Most of the pause in warming is attributed to natural ENSO (El Nino-Southern Oscillation, that is, El Nino and La Nina) activity. First of all let me say I agree with them. It is a step forward for the “skeptics” side o
Aug 01
UAH Global Temperature Update July, 2011: +0.37 deg. C
How ironic..a “global warming denier” reporting on warmer temperatures The global average lower tropospheric temperature anomaly for July, 2011 increased to +0.37 deg. C (click on the image for a LARGE version): Even though the Northern Hemisphere temperature anomaly cooled slightly in July, as did the tropics, warming in the Southern Hemisphere more than made up for it: YR MON GLOBAL
Jul 31

Rise of the 1st Law Deniers
So, we continue to be treated to news articles (e.g. here, and here.) quoting esteemed scientists who claim to have found problems with our paper published in Remote Sensing, which shows huge discrepancies between the real, measured climate system and the virtual climate system imagined by U.N.-affilliated climate modelers and George Soros-affiliated pundits (James Hansen, Joe Romm, et al.) Their
Jul 29

The Debt Crisis: Compromise is Not an Option
We are used to politicians having to compromise in Washington. Compromise is viewed as a good thing. Both sides get some of what they want. What our country is facing with the current budget crisis, however, is a totally different situation. We are not discussing how much this constituency gets out of tax revenue versus that constituency. We are instead dealing with the very real possibility

Fallout from Our Paper: The Empire Strikes Back
UPDATE: Due to the many questions I have received over the last 24 hours about the way in which our paper was characterized in the original Forbes article, please see the new discussion that follows the main post, below. LiveScience.com posted an article yesterday where the usual IPCC suspects (Gavin Schmidt, Kevin Trenberth, and Andy Dessler) dissed our recent paper in in the journal Remote Sens
Jul 25
Our Feedback Diagnosis Paper is Published Today
UPDATE: Since it appears the web traffic trying to access our paper has overloaded the publisher’s server, you can get a copy here. On the Misdiagnosis of Surface Temperature Feedbacks from Variations in Earth’s Radiant Energy Balance was published today in the journal, Remote Sensing, and a pdf is available. I discussed the findings here.
Jul 22
Modeled Ocean Temperatures from 1880 through 2010
This is an update of my last post, where I described the results of a Forcing-Feedback-Diffusion (FFD) model of ocean temperature variations to 2,000 meters deep. The model assumes the GISS-assumed forcings since 1880, including greenhouse gases, volcanoes, and manmade aerosol pollution. To those, I added a forcing term proportional to El Nino/La Nina activity, equal to 0.9 x MEI (Multivariate EN
Jul 21
Oh, the Insensitivity! More on Ocean Warming 1955-2010
The evidence for anthropogenic global warming being a false alarm does not get much more convincing than this, folks. Using a combination of the GISS-assumed external forcings for long-term temperature changes, and an El Nino/La Nina internal forcing term for year-to-year variability, a simple Forcing-Feedback-Diffusion (FFD) model explains 90% of the variance in ocean heat content variations in t
Jul 15
Our Refutation of Dessler (2010) is Accepted for Publication
Some of you might remember last year’s little dust-up between Andy Dessler and me over feedbacks in the climate system. Our early-2010 paper showed extensive evidence of why previous attempts to diagnose feedbacks (which determine climate sensitivity) have likely led to overestimates of how sensitive the climate system is to forcings like that from increasing CO2. The basic reason is that interna
Jul 14

Atlantis Launch SRB Camera Videos
This is SO cool. Cameras mounted on both of the solid rocket boosters during the final Shuttle launch show what it would be like to ride one from the launch pad, into space, falling back through the atmosphere, and then splashing into the ocean. The total video runs 32 minutes, with multiple camera views from both boosters. I watched the whole thing and is it was worth it.
Jul 13
Understanding James Hansen’s View of Our Climate Future
I’ve been wading through James Hansen’s recent 52-page unpublished paper explaining why he thinks the cooling effect of manmade sulfate aerosols has been underestimated by climate modelers. This is the same theme as the “cooling from Chinese pollution is canceling out carbon dioxide warming” you might have heard about recently. As I read Hansen’s paper, I stumbled upon a sentence on page 23 that
Jul 08
Global SST Update: Still No Sign of Resumed Warming
Here’s the global average sea surface temperature (SST) update from AMSR-E on NASA’s Aqua satellite, updated through yesterday, July 7, 2011: The anomalies are relative the existing period of record, which is since June 2002. As can be seen, the SSTs have not quite recovered from the coolness of the recent La Nina. Something else I track is the ocean cloud water anomalies, also from AMSR-E, which
More on the Divergence Between UAH and RSS Global Temperatures
After talking with John Christy, I decided I should further expound upon the points I made in my last post. The issue is that the two main satellite-based records of global lower tropospheric temperature change have been diverging in the last 10 years, with the RSS version giving cooler anomalies than our (UAH) version in recent years, as shown in the following plot: (the RSS anomalies have been r
Jul 07
On the Divergence Between the UAH and RSS Global Temperature Records
…or, OMG! HAS UAH BEEN BOUGHT OFF BY GREENPEACE!? Over the last ten years or so there has been a growing inconsistency between the UAH and Remote Sensing Systems versions of the global average lower tropospheric temperature anomalies. Since I sometimes get the question why there is this discrepancy, I decided it was time to address it. If we look at the entire 30+ year record, we see that the UAH
UAH Global Temperature Update for June, 2011: +0.31 deg. C
Post-La Nina Warming Continues The global average lower tropospheric temperature anomaly for June, 2011 increased to +0.31 deg. C (click on the image for a LARGE version): The Northern Hemisphere, Southern Hemisphere, and and Tropics all experienced temperature anomaly increases in June: YR MON GLOBAL NH SH TROPICS 2011 1 -0.010 -0.055 +0.036 -0.372 2011 2 -0.02
Jul 04

FUNDANOMICS: The Free Market, Simplified
I’m pretty excited that today (Independence Day, 2011) is the release date for my new book, Fundanomics: The Free Market, Simplified. Our friend, Josh, did the cover art and it perfectly captures one of the book’s main messages: the greatest prosperity for ALL in a society is achieved when people are free to benefit from their good ideas. In Chapter 1, A Tale of Two Neanderthals, Borgg and Gl
Jun 25
More Evidence that Global Warming is a False Alarm: A Model Simulation of the last 40 Years of Deep Ocean Warming
NOTE: I am making available the Excel spreadsheet with the simple forcing-feedback-diffusion model so people can experiment with it. The spreadsheet is fairly self-explanatory. THE DIFFUSION COEFFICIENTS CANNOT BE VARIED TOO DRASTICALLY SINCE, WITH A MONTHLY TIME STEP, THE MODEL WILL CREATE UNSTABLE TEMPERATURE OSCILLATIONS. This is a common problem with numerical integration, which could be eli
Jun 07
UAH Temperature Update for May, 2011: +0.13 deg. C
Little Change from Last Month The global average lower tropospheric temperature anomaly for May, 2011 was just about the same as last month: up slightly to +0.13 deg. C (click on the image for a LARGE version): Note the tropics continue to warm as La Nina fades: YR MON GLOBAL NH SH TROPICS 2011 1 -0.010 -0.055 0.036 -0.372 2011 2 -0.020 -0.042 0.002 -0.348
Jun 06
Recent Cooling of Northern Hemisphere Mid-Latitudes Viewed from Aqua
I’ve been getting quite a few e-mails about the data on the UAH/NASA Discover website, which gives daily global average deep-layer average temperatures from the AMSU instruments on the NOAA-15 satellite and NASA’s Aqua satellite (as well as sea surface temperatures from the AMSR-E instrument on Aqua). I have been advising users that, of all the AMSU channels listed there, to trust only the “ch. 5″
May 25
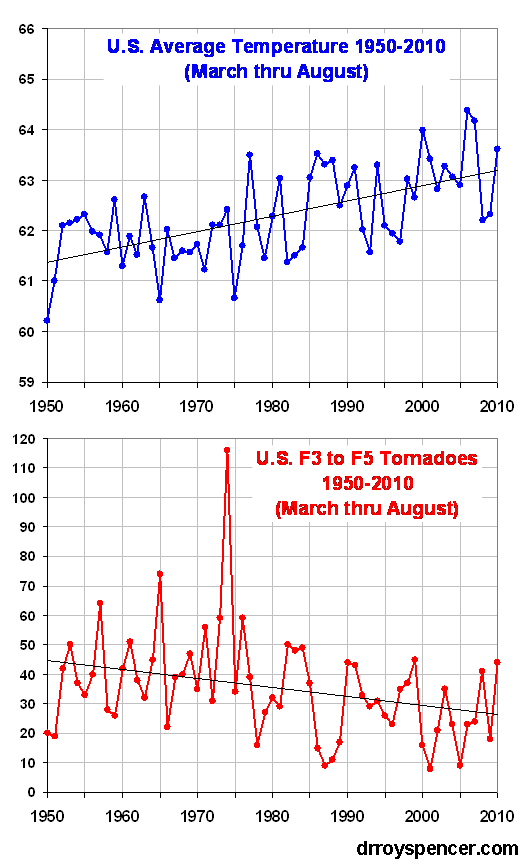
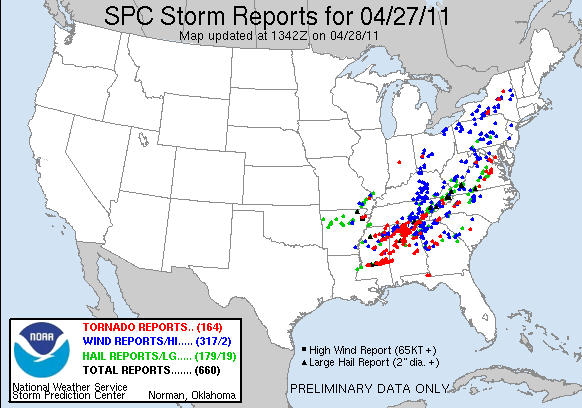
The Tornado – Pacific Decadal Oscillation Connection
This is a continuation of the theme of my last 2 blog posts, dealing with the fact that a greater number of strong to violent tornadoes occur in unusually COOL years, not warm years. As a quick review, the following plot clearly shows this: This refutes the claim of a few of the global-warming-causes-everything pundits who assume that more tornadoes MUST be Gaia’s way of punishing us for providi
May 24
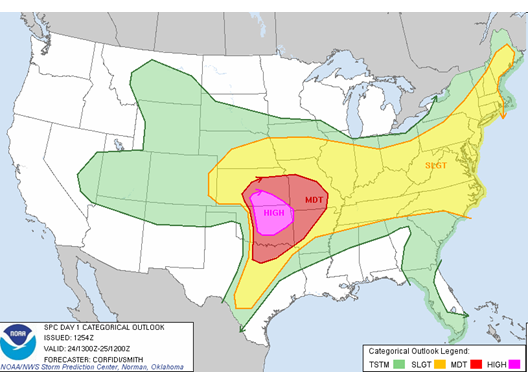
Today’s Tornado Outlook: High Risk of Global Warming Hype
After the catastrophic death toll from the Joplin, MO tornado, which now stands at 117, we are no doubt in for more claims — dutifully amplified by the news media — that ‘climate change’ must somehow be at least partly responsible for this Spring’s wild weather. And, to some extent, I’m inclined to agree. That is, if they are talking about the natural cooling effects of La Nina and the tendency
May 19
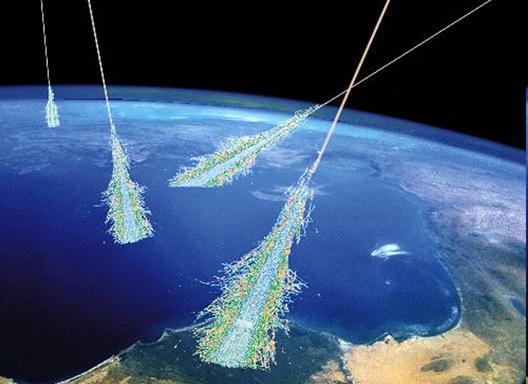
Indirect Solar Forcing of Climate by Galactic Cosmic Rays: An Observational Estimate
UPDATE (12:35 p.m. CDT 19 May 2011): revised corrections of CERES data for El Nino/La Nina effects. While I have been skeptical of Svensmark’s cosmic ray theory up until now, it looks like the evidence is becoming too strong for me to ignore. The following results will surely be controversial, and the reader should remember that what follows is not peer reviewed, and is only a preliminary estima
May 12
Weak Warming of the Oceans 1955-2010 Implies Low Climate Sensitivity
UPDATE (1:20 pm. CDT 5/13/11): Since the issue of deep ocean warming (below 700 m depth) has been raised in the comments section, I have re-run the forcing-feedback model for the following two observations: 1) a net 50 year warming of 0.06 deg. C for the 0-2000 meter layer, and (2) a surface warming of 0.6 deg. C over the same period. The results suggest a net feedback parameter of 3 W m-2 K-1, w
May 10
UAH Temperature Update for April, 2011: +0.12 deg. C
YR MON GLOBAL NH SH TROPICS 2010 01 0.542 0.675 0.410 0.635 2010 02 0.510 0.553 0.466 0.759 2010 03 0.554 0.665 0.443 0.721 2010 04 0.400 0.606 0.193 0.633 2010 05 0.454 0.642 0.265 0.706 2010 06 0.385 0.482 0.287 0.485 2010 07 0.419 0.558 0.280 0.370 2010 08 0.441 0.579 0.3
May 03
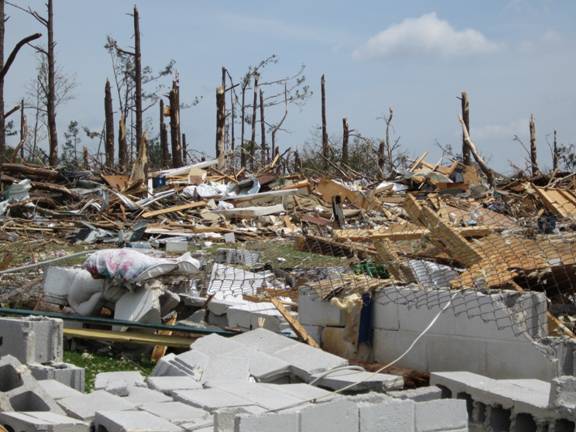
Tornado Cleanup in Fords Chapel, Alabama
Power is gradually being restored in and around Huntsville. UAH is closed till tomorrow, which would be my first day back to work in a week…except that I have to go to DC for the biannual NASA Aqua satellite review. Yesterday I helped with the tornado cleanup effort in Fords Chapel, a small community northwest of Huntsville on the edge of Anderson Hills…an area that has now gone through its secon
Apr 29
MORE Tornadoes from Global Warming? That’s a Joke, Right?
I see the inevitable blame-humanity game has been reinvigorated by the recent tornado swarm. I have not read other meteorologists’ treatment of this issue, so what follows can be considered an independent opinion on the matter. If there is one weather phenomenon global warming theory does NOT predict more of, it would be severe thunderstorms and tornadoes. Tornadic thunderstorms do not require tr
Tornado Update #2 from Huntsville
Thanks to everyone for the well wishes and prayers. After seeing the devastation in Tuscaloosa, the suburbs of Birmingham, and entire small communities that were destroyed, we were pretty lucky right here in Huntsville proper, with little damage. Anderson Hills just to the north of town got hit AGAIN…it’s had three tornado disasters since I’ve been in Huntsville, as I recall. Some places just se
Apr 28
Tornado Update from Alabama
The power is out here in Huntsville and over much of northern Alabama. Everything is shut down. Only cell phone service is up, and since I have Verizon broadband on my laptop, I’m spend some of my last 40 minutes worth of battery power to update everyone. As a meteorologist, I must say that yesterday here in North Alabama was simply amazing. Virtually every thunderstorm that formed was rotating,
Apr 05
UAH Temperature Update for March, 2011: Cooler Still -0.10 deg. C
YR MON GLOBAL NH SH TROPICS 2010 01 0.542 0.675 0.410 0.635 2010 02 0.510 0.553 0.466 0.759 2010 03 0.554 0.665 0.443 0.721 2010 04 0.400 0.606 0.193 0.633 2010 05 0.454 0.642 0.265 0.706 2010 06 0.385 0.482 0.287 0.485 2010 07 0.419 0.558 0.280 0.370 2010 08 0.441 0.579 0.
Apr 02
On Recent Criticisms of My Research
One of the downsides of going against the supposed “consensus of scientists” on global warming — other than great difficulty in getting your research funded and published — is that you get attacked in the media. In the modern blogging era, this is now easier to do than ever. I have received many requests recently to respond to an extended blog critique by Barry Bickmore of my book, The Great Glob
Mar 18

Global SST Update through mid-March 2011
It has been awhile since I provided an update to the global average sea surface temperature plot, shown below through yesterday (March 17, 2011). As can be seen, SSTs remain below normal. The trend line is close to zero, so still no sign of “global warming” having resumed. The corresponding water vapor plot (vertically integrated) shows a rather spectacular plunge in recent weeks:
Mar 02
UAH Temperature Update for Feb. 2011: -0.02 deg. C
YR MON GLOBE NH SH TROPICS 2010 1 0.542 0.675 0.410 0.635 2010 2 0.510 0.553 0.466 0.759 2010 3 0.554 0.665 0.443 0.721 2010 4 0.400 0.606 0.193 0.633 2010 5 0.454 0.642 0.265 0.706 2010 6 0.385 0.482 0.287 0.485 2010 7 0.419 0.558 0.280 0.370 2010 8 0.441 0.579 0.304
Feb 19
On the House Vote to Defund the IPCC
The climate change deniers have no one but themselves to blame for last night’s vote. I’m talking about those who deny NATURAL climate change. Like Al Gore, John Holdren, and everyone else who thinks climate change was only invented since they were born. Politicians formed the IPCC over 20 years ago with an endgame in mind: to regulate CO2 emissions. I know, because I witnessed some of the behin
Feb 18
Fire & Water: Some Thoughts on Wood Stove Design and Efficiency
Fire & Water: Some Thoughts on Wood Stove Design and Efficiency Sometimes I have to get away from the climate stuff for awhile. This is one of those times. Also, each year at this time my wife asks how we can get our swimming pool to warm up quicker this spring. Even after 20 years, global warming hasn’t helped a darn bit. She also always mentions wood heat as a possibility. I have alway
Feb 09
Radiative Changes Over the Global Oceans During Warm and Cool Events
In my continuing efforts to use satellite observations to test climate models that predict global warming, I keep trying different ways to analyze the data. Here I’ll show how the global oceanic radiative budget changes during warm and cool events, which are mostly due to El Niño and La Niña (respectively). By ‘radiative budget’ I am talking about top-of-atmosphere absorbed sunlight and emitted
Feb 02
UAH Update for January 2011: Global Temperatures in Freefall
…although this, too, shall pass, when La Nina goes away. YR MON GLOBE NH SH TROPICS 2010 1 0.542 0.675 0.410 0.635 2010 2 0.510 0.553 0.466 0.759 2010 3 0.554 0.665 0.443 0.721 2010 4 0.400 0.606 0.193 0.633 2010 5 0.454 0.642 0.265 0.706 2010 6 0.385 0.482 0.287 0.485 2010 7 0.419 0.5
A Challenge to the Climate Research Community
I’ve been picking up a lot of chatter in the last few days about the ’settled science’ of global warming. What most people don’t realize is that the vast majority of published research on the topic simply assumes that warming is manmade. It in no way “proves” it. If the science really is that settled, then this challenge should be easy: Show me one peer-reviewed paper that has ruled out natural,
Jan 31
Omg! Another Global Warming Snowstorm!!
I really can’t decide whether I should hate Al Gore… or thank him for giving me something to write about. He has caused the spread of more pseudo-scientific incompetence on the subject of global warming (I’m sorry — climate change) than any climate scientist could possibly have ever accomplished. Who else but a politician could spin so much certainty out of a theory? As someone who has lived a
Jan 28
UPDATE: Further Evidence of Low Climate Sensitivity from NASA’s Aqua Satellite
After yesterday’s post, I decided to run the simple forcing-feedback model we developed to mimic the Aqua satellite observations of global oceanic temperature and radiative flux variations. I’ve also perused the comments people have made there, and will try to clarify what I’ve done and why it’s important. First of all, my (and even the IPCC’s) emphasis on changes in the global radiative budget ca
Jan 27
New Results on Climate Sensitivity: Models vs. Observations
Partly as a result of my recent e-mail debate with Andy Dessler on cloud feedbacks (the variable mostly likely to determine whether we need to worry about manmade global warming), I have once again returned to an analysis of the climate models and the satellite observations. I have just analyzed the 20th Century runs from the IPCC’s three most sensitive models (those producing the most global warm
Jan 20
Dessler-Spencer Cloud Feedback Debate Update
The e-mail debate I have been having with Andy Dessler over his recent paper purporting to show positive cloud feedback in 10 years of satellite data appears to have reached an impasse. Dick Lindzen has chimed in on my side in recent days, but Andy continues to claim that – at least during the 2000-2010 period in question — I have provided no evidence that clouds cause climate variations. This i
Jan 03
Dec. 2010 UAH Global Temperature Update: +0.18 deg. C
UPDATE #1(1/3/10, 2:50 p.m. CST): Graph fixed…it was missing Dec. 2010. UPDATE #2(1/3/10, 3:25 p.m. CST): Appended global sea surface temperature anomalies from AMSR-E. NEW 30-YEAR BASE PERIOD IMPLEMENTED! YR MON GLOBE NH SH TROPICS 2010 1 0.542 0.675 0.410 0.635 2010 2 0.510 0.553 0.466 0.759 2010 3
Why Most Published Research Findings are False
Those aren’t my words — it’s the title of a 2005 article, brought to my attention by Cal Beisner, which uses probability theory to “prove” that “…most claimed research findings are false”. While the article comes from the medical research field, it is sufficiently general that some of what it discusses can be applied to global warming research as well. I would argue that the situation is even w
Dec 31 2010
Dessler and Spencer Debate Cloud Feedback
What follows is a mini-debate by e-mail during the last 3 weeks between myself and Andy Dessler over the question of whether cloud feedbacks in the climate system are positive or negative. Last night, Andy Revkin suggested that I post it. I believe this e-mail exchange is rather unusual during a time when scientists arguing over global warming more often spar with sound bites in the popular pre
Dec 09 2010
The Dessler Cloud Feedback Paper in Science: A Step Backward for Climate Research
How clouds respond to warming – the ‘cloud feedback’ problem – will likely determine whether manmade global warming becomes either the defining environmental event of the 21st Century, or is merely lost in the noise of natural climate variability. Unfortunately, diagnosing cloud feedback from our global satellite observations has been surprisingly difficult. The problem isn’t the quality of the da
Dec 07 2010
Gore Effect Strikes Cancun
Today’s my first full day in Cancun at COP-16, and as I emerged from my hotel room I was greeted by a brisk, dry, cool Canadian breeze. It was 54 deg. F in Cancun this morning — a record low for the date. (BTW, Cancun is nowhere near Canada). Al Gore is not supposed to be here…but it could be that the Gore Effect has announced his secret arrival. We will check into this. The following pic I took
Dec 03 2010
Nov. 2010 UAH Global Temperature Update: +0.38 deg. C
YR MON GLOBE NH SH TROPICS 2010 1 0.648 0.860 0.436 0.681 2010 2 0.603 0.720 0.486 0.791 2010 3 0.653 0.850 0.455 0.726 2010 4 0.501 0.799 0.203 0.633 2010 5 0.534 0.775 0.292 0.708 2010 6 0.436 0.550 0
Nov 18 2010

Alternative Energy Research Highlighted at Vancouver Engineering Conference
I just returned from Vancouver (the one in Canada), where the American Society of Mechanical Engineers (ASME) has been holding their annual meeting at the Vancouver Convention Center. I was asked to present one of their keynote talks, so on Tuesday evening I spent about 45 minutes outlining some of the global warming science that the engineers might not heard about from global warming experts lik
Nov 08 2010
Climate Scientists Plan Campaign Against Global Warming Skeptics
“The American Geophysical Union plans to announce that 700 researchers have agreed to speak out on the issue. Other scientists plan a pushback against congressional conservatives who have vowed to kill regulations on greenhouse gas emissions.” A new article in the LA Times says that the American Geophysical Union (AGU) is enlisting the help of 700 scientists to fight back against a new congress th
Nov 01 2010
Oct. 2010 UAH Global Temperature Update: +0.42 deg. C
YR MON GLOBE NH SH TROPICS 2009 1 0.251 0.472 0.030 -0.068 2009 2 0.247 0.565 -0.071 -0.045 2009 3 0.191 0.324 0.058 -0.159 2009 4 0.162 0.315 0.008 0.012 2009 5 0.139 0.161 0.118 -0.059 2009 6 0.041 -0.021 0.103 0.105 2009 7 0.429 0.190 0.668 0.506 2009 8 0.242 0.236 0.248 0.406 2009 9 0.505 0.59
Global Warming Elitism, Tomorrow’s Election, and The Future
The NASA A-Train satellite constellation symposium I attended last week in New Orleans was in some sense a celebration of the wide variety of global satellite observations we are now collecting from Earth orbit. This really is the Golden Age in satellite data collection of the global climate system. While a few A-Train satellites are still to be launched, other older satellite assets in the A-Tr
Oct 28 2010
Bottom Falling Out of Global Ocean Surface Temperatures?
Having just returned from another New Orleans meeting – this time, a NASA A-Train satellite constellation symposium — I thought I would check the latest sea surface temperatures from our AMSR-E instrument. The following image shows data updated through yesterday (October 27). Needless to say, there is no end in sight to the cooling. (Click on image for the full-size version). Since these SST mea
Oct 16 2010

Does CO2 Drive the Earth’s Climate System? Comments on the Latest NASA GISS Paper
(edited for clarity at 2:45 p.m.) There was a very clever paper published in Science this past week by Lacis, Schmidt, Rind, and Ruedy that uses the GISS climate model (ModelE) in an attempt to prove that carbon dioxide is the main driver of the climate system. This paper admits that its goal is to counter the oft-quoted claim that water vapor is the main greenhouse gas in our atmosphere. (They pr
Oct 05 2010
Meanwhile, Sea Surface Temperatures Continue to Fall
Since I just provided the September 2010 global tropospheric temperature update, I decided it was time to update the global SST data record from the AMSR-E instrument flying on Aqua. The following plot, updated through yesterday (October 4, 2010) shows that both the global average SST, and the Nino3.4 region average from the tropical E. Pacific, continue to cool. (click on the plot for the full-
September 2010 UAH Global Temperature Update: +0.60 deg. C
YR MON GLOBE NH SH TROPICS 2009 1 0.251 0.472 0.030 -0.068 2009 2 0.247 0.565 -0.071 -0.045 2009 3 0.191 0.324 0.058 -0.159 2009 4 0.162 0.315 0.008 0.012 2009 5 0.139 0.161 0.118 -0.059 2009 6 0.041 -0.021 0.103 0.105 2009 7 0.429 0.190 0.668 0.506 2009 8 0.242 0.236 0.248 0.406 2009 9 0.505 0.59
Oct 04 2010

A Mock Global Warming Trial in the Big Easy
I’ve been out of pocket for a while, partly because I have been preparing to provide expert testimony in a mock global warming trial. The mock trial was the final event at the ABA Section of Environment, Energy, and Resources Law Summit held at the Sheraton New Orleans this past week. We had a good turnout, with approximately 200 attorneys there to watch the show. The mock trial was patterned a
Sep 14 2010
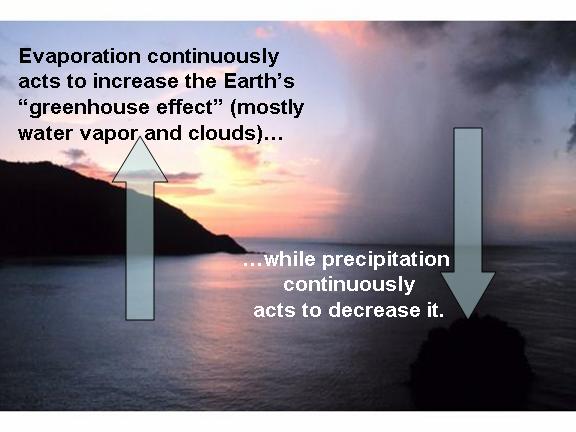
Five Reasons Why Water Vapor Feedback Might Not Be Positive
Since it has been a while since I have addressed water vapor feedback, and I am now getting more questions about it, I thought this would be a good time to revisit the issue and my opinions on the subject. Positive water vapor feedback is probably the most “certain” and important of the feedbacks in the climate system in the minds of mainstream climate researchers. Weak warming caused by more car
Sep 13 2010
Why 33 deg. C for the Earth’s Greenhouse Effect is Misleading
In my previous post I argued, using commonly cited numbers, that the greenhouse effect enhancement of adding carbon dioxide to the atmosphere would be about 3% for a doubling of CO2 (“2XCO2”). The 3% enhancement is based upon 2 commonly quoted numbers: (1) 33 deg. C global-average surface warming for the natural greenhouse effect, and (2) about 1 deg. C additional surface warming from 2XCO2, with
Sep 10 2010
On the Relative Contribution of Carbon Dioxide to the Earth’s Greenhouse Effect
[NOTE: What follows assumes the direct (no-feedback) infrared radiative effects of greenhouse gases (water vapor, CO2, methane, etc.) on the Earth’s radiative budget are reasonably well understood. If you want to challenge that assumption, your time might be better spent here.] I was recently asked by a reader to comment on a new paper by Schmidt et al. which put some numbers behind the common q
Sep 02 2010
August 2010 UAH Global Temperature Update: +0.51 deg. C
YR MON GLOBE NH SH TROPICS 2009 1 0.251 0.472 0.030 -0.068 2009 2 0.247 0.565 -0.071 -0.045 2009 3 0.191 0.324 0.058 -0.159 2009 4 0.162 0.315 0.008 0.012 2009 5 0.139 0.161 0.118 -0.059 2009 6 0.041 -0.021 0.103 0.105 2009 7 0.429 0.190 0.668 0.506 2009 8 0.242 0.236 0.248 0.406 2009 9 0.505 0.59
Sep 01 2010
On the Debunking of Spencer’s Feedback Ideas: An Appeal to Physical Scientists Everywhere
I am seeing increasing chatter about one or more papers that will (or already have) debunked my ideas on feedbacks in the climate system. Yet, I cannot remember a climate issue of which I have ever been so certain. I understand that most people interested in the climate debate will simply believe what their favorite science pundits at RealClimate tell them to believe, which is fine, and I can’t

The IPCC, Tipping Points, and Why Global Warming Must Remain Uncertain
Now that I have opened the political Pandora’s Box, I might as well continue getting some of this off my chest. Some people think that I hurt my scientific credibility by revealing my political views from time to time. Well, I don’t like politicians exploiting and ultimately destroying public faith in my scientific discipline (climate science) for their own political and financial gain. We s
Aug 31 2010
The Persistence of Paradigms
I received a question from a reader today regarding why the writer of a recent article summarizing the state of the science on cloud feedbacks did not mention our newly published work. The usual suspects were questioned, but there was nothing new there. Cloud feedbacks are just as uncertain today as they were 20 years ago, blah, blah. More of the same. Now, I would like to think our new paper
Aug 30 2010

Dump the IPCC Process, It Cannot Be Fixed
In a recent opinion piece, Ross McKitrick has argued that the IPCC process needs to be fixed. He correctly points out that, “There is too much conflict of interest built into the report-writing process”. But I say the process cannot be fixed. DUMP the IPCC process. The reason why is because the IPCC process was never created to achieve what the U.N. claims, and what most people believe it exis
Aug 27 2010
Our JGR Paper on Feedbacks is Published
After years of re-submissions and re-writes — always to accommodate a single hostile reviewer — our latest paper on feedbacks has finally been published by Journal of Geophysical Research (JGR). Entitled “On the Diagnosis of Feedback in the Presence of Unknown Radiative Forcing“, this paper puts meat on the central claim of my most recent book: that climate researchers have mixed up cause and effe
Aug 20 2010
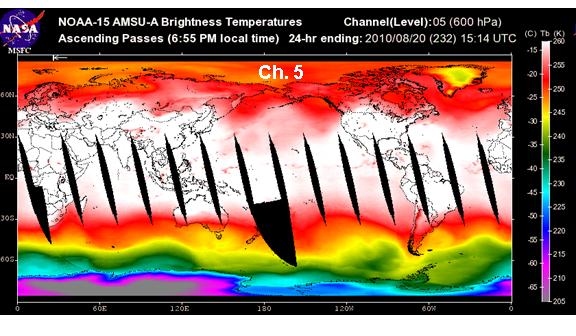
Daily Global Temperature Updates on the Discover Website: An Updated Tutorial
I’m getting more and more questions about the daily global temperature updates we provide at the NASA Discover website. I suppose this is because 2010 is still in the running to beat 1998 as the warmest year in our satellite data record (since 1979). But also we have made a couple of significant changes recently, and there continue to be some misunderstandings of the data that are posted there.
Aug 19 2010

Still Cooling: Sea Surface Temperatures thru August 18, 2010
Sea Surface Temperatures (SSTs) measured by the AMSR-E instrument on NASA’s Aqua satellite continue the fall which began several months ago. The following plot, updated through yesterday (August 18, 2010) reveals the global average SSTs continue to cool, while the Nino34 region of the tropical east Pacific remains well below normal, consistent with La Nina conditions. (click on it for the large,
Aug 06 2010

Help! Back Radiation has Invaded my Backyard!
Measuring The (Nonexistent) Greenhouse Effect in My Backyard with a Handheld IR Thermometer and The Box Laypersons are no doubt confused by all of our recent esoteric discussions regarding radiative transfer, and whether global warming is even possible from a theoretical standpoint. So, let’s take a break and return to the real world, and the experiments you can do yourself to see evidence of the
Aug 05 2010
Comments on Miskolczi’s (2010) Controversial Greenhouse Theory
SPECIAL MESSAGE: For those following Miskolczi’s work, and his claims regarding “Aa=Ed”, if those two radiative fluxes (Aa and Ed) are not EXACTLY equal, then Miskolczi has found nothing that disagrees with current greenhouse theory. That they are NEARLY equal has been known for a long time (e.g. Kiehl & Trenberth, 1997). Their near-equality is due to the fact that IR radiative flows are cont
Aug 03 2010

July 2010 UAH Global Temperature Update: +0.49 deg. C
YR MON GLOBE NH SH TROPICS 2009 1 0.251 0.472 0.030 -0.068 2009 2 0.247 0.565 -0.071 -0.045 2009 3 0.191 0.324 0.058 -0.159 2009 4 0.162 0.315 0.008 0.012 2009 5 0.139 0.161 0.118 -0.059 2009 6 0.041 -0.021 0.103 0.105 2009 7 0.429 0.190 0.668 0.506 2009 8 0.242 0.236 0.248 0.406 2009 9 0.505 0.597
Jul 30 2010
Global Sea Surface Temperature Update: The Cooling Continues
Sea Surface Temperatures (SSTs) measured by the AMSR-E instrument on NASA’s Aqua satellite continue the fall which began several months ago. The following plot, updated through yesterday (July 29, 2010) shows that the cooling in the Nino34 region in the tropical east Pacific continue to be well ahead of the cooling in the global average SST, something we did not see during the 2007-08 La Nina eve
Jul 29 2010
First Results from THE BOX: Investigating the Effects of Infrared Sky Radiation on Air Temperature
(UPDATED: 3:10 p.m. July 29, 2010 with temperature difference plot) As promised, here are the first results from my little backyard experiment to investigate the role of downwelling infrared (IR) sky radiation on air temperature. (High school students looking for a science experiment, pay attention). It’s a heavily insulated box that — theoretically — should chill air at night to a temperatur
Jul 27 2010
Experiment to Test the Temperature Influence of Infrared Sky Radiation
As a follow-up to my controversial post on the effect of infrared “back radiation” downwelling from the colder sky to the warmer surface, the existence of which some dispute (despite the real-time availability of such data), I’ve come up with an experimental setup to see how IR radiation from the sky influences air temperature near the ground. (Yes, I know some of you think there is no such thing
Jul 23 2010
Yes, Virginia, Cooler Objects Can Make Warmer Objects Even Warmer Still
Probably as the result of my recent post explaining in simple terms my “skepticism” about global warming being mostly caused by carbon dioxide emissions, I’m getting a lot of e-mail traffic from some nice folks who are trying to convince me that the physics of the so-called Greenhouse Effect are not physically possible. More specifically, that adding CO2 to the atmosphere is not physically capable
Jul 19 2010
Can Climate Feedbacks be Diagnosed from Satellite Data? Comments on the Murphy & Forster
There is a new paper in press at the Journal of Climate that we were made aware of only a few days ago (July 14, 2010). It specifically addresses our (Spencer & Braswell, 2008, hereafter SB08) claim that previous satellite-based diagnoses of feedback have substantial low biases, due to natural variations in cloud cover of the Earth. This is an important issue. If SB08 are correct, then the c
Jul 17 2010
My Global Warming Skepticism, for Dummies
I receive many e-mails, and a recurring complaint is that many of my posts are too technical to understand. This morning’s installment arrived with the subject line, “Please Talk to Us”, and suggested I provide short, concise, easily understood summaries and explanations “for dummies”. So, here’s a list of basic climate change questions, and brief answers based upon what I know today. I might upd
Jul 01 2010
June 2010 UAH Global Temperature Update: +0.44 deg. C
YR MON GLOBE NH SH TROPICS 2009 1 0.251 0.472 0.030 -0.068 2009 2 0.247 0.564 -0.071 -0.045 2009 3 0.191 0.324 0.058 -0.159 2009 4 0.162 0.316 0.008 0.012 2009 5 0.140 0.161 0.119 -0.059 2009 6 0.043 -0.017 0.103 0.110 2009 7 0.429 0.189 0.668 0.506 2009 8 0.242 0.235 0.248 0.406 2009 9 0.505 0.5
Jun 24 2010

Dr. Roy Spencer, One of America’s 100 Most Hated by the Left
What follows is the text of the speech I gave at Townhall Magazine’s 100 Americans Most Hated by the Left awards dinner that I attended last night in Washington, DC. There were 96 recipients (95, actually) who spoke before me, and most were well worth listening to. I will briefly review a few of the highlights…. Glenn Beck went first, being Townhall’s pick for the coveted, #1 Most Hated spot.
Jun 23 2010
Revisiting the Pinatubo Eruption as a Test of Climate Sensitivity
The eruption of Mt. Pinatubo in the Philippines on June 15, 1991 provided a natural test of the climate system to radiative forcing by producing substantial cooling of global average temperatures over a period of 1 to 2 years. There have been many papers which have studied the event in an attempt to determine the sensitivity of the climate system, so that we might reduce the (currently large) un
Jun 22 2010

The Global Warming Inquisition Has Begun
A new “study” has been published in the Proceedings of the National Academy of Sciences (PNAS) which has examined the credentials and publication records of climate scientists who are global warming skeptics versus those who accept the “tenets of anthropogenic climate change”. Not surprisingly, the study finds that the skeptical scientists have fewer publications or are less credentialed than t
Jun 18 2010
Global Average Sea Surface Temperatures Continue their Plunge
Sea Surface Temperatures (SSTs) measured by the AMSR-E instrument on NASA’s Aqua satellite continue their plunge as a predicted La Nina approaches. The following plot, updated through yesterday (June 17, 2010) shows that the cooling in the Nino34 region in the tropical east Pacific is well ahead of the cooling in the global average SST, something we did not see during the 2007-08 La Nina event (c
Jun 17 2010

FAQ #271: If Greenhouse Gases are such a Small Part of the Atmosphere, How Do They Change Its Temperature?
NOTE posted 9:20 a.m. CDT 21 June, 2010: Upon reading the comments here, its obvious some have misinterpreted what I am discussing here. It’s NOT why greenhouse gases act to warm the lower atmosphere, it’s why a given parcel of air containing a very small fraction of greenhouse gases can be thoroughly warmed (or cooled, if in the upper atmosphere) by them. Some of the questions I receive from the
Update on the Role of the Pacific Decadal Oscillation in Global Warming
UPDATE: more edits & enhancements for clarity made at 3:35 CDT, June 17, 2010. I’ve returned to the issue of determining to what extent the Pacific Decadal Oscillation (PDO) can at least partly explain global average temperature variations, including warming, during the 20th Century. We tried publishing a paper on this over a year ago and were immediately and swiftly rejected in a matter of
Jun 15 2010
Evidence of Elevated Sea Surface Temperatures Under the BP Oil Slick
(NOTE: minor edits made at 10:00 a.m. CDT, June 15, 2010) As summer approaches, sea surface temperatures (SSTs) in the Gulf of Mexico increase in response to increased solar insolation (intensity of sunlight). Limiting the SST increase is evaporation, which increases nonlinearly with SST and approximately linearly with increased wind speed. It is important to realize that the primary heat loss
Jun 06 2010
Warming in Last 50 Years Predicted by Natural Climate Cycles
One of the main conclusions of the 2007 IPCC report was that the warming over the last 50 years was most likely due to anthropogenic pollution, especially increasing atmospheric CO2 from fossil fuel burning. But a minority of climate researchers have maintained that some — or even most — of that warming could have been due to natural causes. For instance, the Pacific Decadal Oscillation (PDO) and
Jun 04 2010
Updated: Low Climate Sensitivity Estimated from the 11-Year Cycle in Total Solar Irradiance
NOTE: This has been revised since finding an error in my analysis, so it replaces what was first published about an hour ago. As part of an e-mail discussion on climate sensitivity I been having with a skeptic of my skepticism, he pointed me to a paper by Tung & Camp entitled Solar-Cycle Warming at the Earth’s Surface and an Observational Determination of Climate Sensitivity. The authors try
May 2010 UAH Global Temperature Update: +0.53 deg. C.
YR MON GLOBE NH SH TROPICS 2009 1 0.251 0.472 0.030 -0.068 2009 2 0.247 0.564 -0.071 -0.045 2009 3 0.191 0.324 0.058 -0.159 2009 4 0.162 0.316 0.008 0.012 2009 5 0.140 0.161 0.119 -0.059 2009 6 0.043 -0.017 0.103 0.110 2009 7 0.429 0.189 0.668 0.506 2009 8 0.242 0.235 0.248 0.406 2009 9 0.505 0.5
Jun 02 2010
Millennial Climate Cycles Driven by Random Cloud Variations
I’ve been having an e-mail discussion with another researcher who publishes on the subject of climate feedbacks, and who remains unconvinced of my ideas regarding the ability of clouds to cause climate change. Since I am using the simple forcing-feedback model as evidence of my claims, I thought I would show some model results for a 1,000 year integration period. What I want to demonstrate is on
May 31 2010
Misinterpreting Natural Climate Change as Manmade
The simple climate model I have made publicly available can be used to demonstrate many basic concepts regarding climate change. Here I will use it to demonstrate that the global warming so commonly blamed on humanity’s greenhouse gas emissions can just as easily be explained as largely natural in origin, most likely due to a natural decrease in global cloud cover. In general, there are TWO P
May 23 2010
The Missing Climate Model Projections
The strongest piece of evidence the IPCC has for connecting anthropogenic greenhouse gas emissions to global warming (er, I mean climate change) is the computerized climate model. Over 20 climate models tracked by the IPCC now predict anywhere from moderate to dramatic levels of warming for our future in response to increasing levels of atmospheric carbon dioxide. In many peoples’ minds this con
May 22 2010
In Defense of the Globally Averaged Temperature
I sometimes hear my fellow climate realists say that a globally-averaged surface temperature has little or no meaning in the global warming debate. They claim it is too ill-defined, not accurately known, or little more than just an average of a bunch of unrelated numbers from different regions of the Earth. I must disagree. The globally averaged surface temperature is directly connected to the glo
May 20 2010
Global Average Sea Surface Temperatures Poised for a Plunge
Just an update…as the following graph shows, sea surface temperatures (SSTs) along the equatorial Pacific (“Nino3.4″ region, red lines) have been plunging, and global average SSTs have turned the corner, too. (Click on the image for the full-size, undistorted version. Note the global values have been multiplied by 10 for display purposes.) The corresponding sea level pressure difference between T
May 14 2010
El Nino Rapidly Fading, La Nina Just Around the Corner?
The most recent El Nino event is rapidly dying, as seen in the following plot of sea surface temperature (SST) variations averaged over the Nino3.4 region (5N to 5S, 120W to 170W) as measured by the AMSR-E instrument on NASA’s Aqua satellite during its period of record, 2 June 2002 through yesterday, 13 May 2010: The 60-day cooling rate as of yesterday was the strongest seen yet in the 8 year per
May 13 2010
By Popular Demand: A Daily Global Average CERES Dataset
Since I keep getting requests for the data from which I do my analyses, I’ve decided to provide the main dataset I use here, in an Excel spreadsheet. The comments at the top of the spreadsheet are pretty self-explanatory and include links to the original data. After you click on and open the file with Excel, save it to your computer so you can analyze the data. What’s In the File, Kenneth? From o
Global Warming’s $64 Trillion Question
Edited 1:35 p.m. CDT 5/13/10: Trivia question added, at the end of the post. Despite its relative simplicity, I continue to find myself trying to explain to experts and lay persons alike how scientists made the Great Global Warming Blunder when it comes to predictions of global warming. On the bright side, this morning I received an e-mail from a chemist who looked at the math of the problem aft
May 07 2010
Strong Negative Feedback from the Latest CERES Radiation Budget Measurements Over the Global Oceans
Arguably the single most important scientific issue – and unresolved question – in the global warming debate is climate sensitivity. Will increasing carbon dioxide cause warming that is so small that it can be safely ignored (low climate sensitivity)? Or will it cause a global warming Armageddon (high climate sensitivity)? The answer depends upon the net radiative feedback: the rate at which the
May 05 2010
APRIL 2010 UAH Global Temperature Update: +0.50 deg. C
YR MON GLOBE NH SH TROPICS 2009 1 0.252 0.472 0.031 -0.065 2009 2 0.247 0.569 -0.074 -0.044 2009 3 0.191 0.326 0.056 -0.158 2009 4 0.162 0.310 0.013 0.012 2009 5 0.140 0.160 0.120 -0.057 2009 6 0.044 -0.011 0.100 0.112 2009 7 0.429 0.194 0.665 0.507 2009 8 0.242 0.229 0.254 0.407 2009 9 0.504 0.5
May 01 2010
Global Tropospheric Temperature Variations Since 2002 over Land Versus Ocean
While investigating cloud feedbacks over the ocean with the CERES Earth radiation budget instruments, I thought I would take a quick look to see how lower atmospheric temperature variations over land and ocean compare to each other. Part of my interest was the recent cold winter over the U.S. and Europe, which has seemed strange to some since our global-average temperatures are running quite warm
Apr 28 2010
Earths Missing Energy: Trenberth’s Plot Proves My Point
The plot that is included in Kevin Trenberth’s most recent post on Roger Pielke, Sr.’s blog actually proves the point I have been making: The trend in the imbalance in the Earth’s radiation budget as measured by the CERES instrument of NASA’s Terra satellite that has been building since about 2000 is primarily in the reflected solar (shortwave, or SW, or RSW) component, not the emitted infrared (l
Apr 26 2010
A Response to Kevin Trenberth
Kevin Trenberth has a response over at Roger Pielke, Sr’s blog to my comments about his and John Fasullo’s recent Science Perspectives article about “missing energy” in the climate system. Trenberth and Fasullo discuss in their original Science Perspectives article the observational evidence for missing energy being lost somewhere in the climate system, based upon satellite radiation budget meas
Simple Climate Model Release, Version 1.0
In my new book, The Great Global Warming Blunder: How Mother Nature Fooled the World’s Top Climate Scientists, I show the results of experiments with a simple climate model that runs in an Excel spreadsheet. The model is meant to illustrate how natural monthly-to-yearly variability in global (a) cloud cover and (b) surface evaporation can affect our satellite observations of (1) temperature and (
Apr 21 2010
Some Comments on Earth’s “Missing Energy”
A recent short article by Kevin Trenberth and John Fasullo discussed the fact that our satellites that monitor (1) the total amount of sunlight absorbed by the Earth, and (2) the total infrared (IR) energy given off by the Earth, have suggested that these flows of energy in and out of the Earth’s climate system have been increasingly out of balance in the last 10 years, with an increase in absorbe
Apr 20 2010
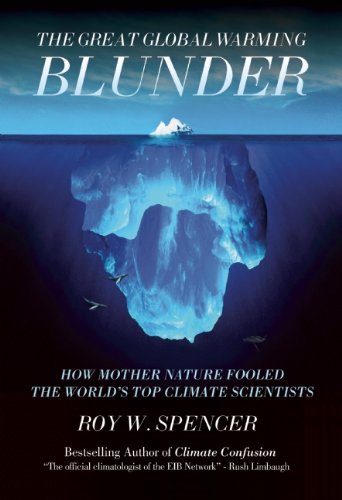
The Great Global Warming Blunder: How Mother Nature Fooled the World’s Top Climate Scientists
Today (April 20) is the official release date of my new book entitled: “The Great Global Warming Blunder: How Mother Nature Fooled the World’s Top Climate Scientists“, published by Encounter Books. About one-half of Blunder is a non-technical description of our new peer reviewed and soon-to-be-published research which supports the opinion that a majority of Americans already hold: that warming in
Apr 14 2010
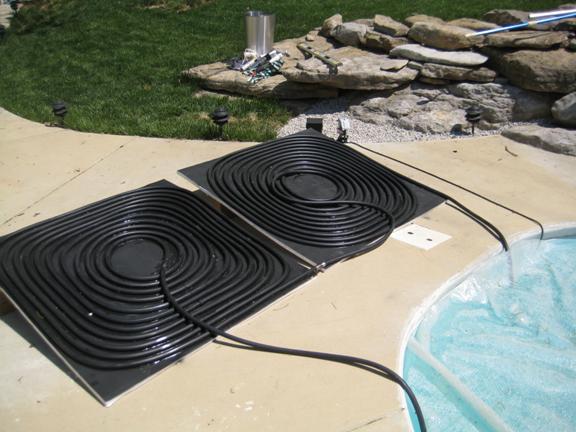
The Spencer’s Swimming Pool Goes Solar
I have always been intrigued by solar power. Getting free energy from the sun is an attractive idea — if one ignores the fact that the equipment necessary to convert that “free” energy into a useful form can get a little pricey. So, combining my interest in solar power with my wife’s desire that our swimming pool warm up faster in the spring (and stay warm later in the fall), I had an excuse to
Correction to UAH v5.3 Global Gridpoint Temperature Dataset
The grid-based monthly anomaly satellite temperature files mounted on our server prior to 14 April 2010 were affected by an error in our recent merging of NOAA-18 into the data stream. This was corrected on 13 April and uploaded on 14 April. The affected files are: tXXmonamg.YYYY_5.3 where XX is lt, mt and ls, and YYYY is year. uahncdc.XX where XX is lt, mt and ls. We are sorry for this problem
Apr 10 2010
The Illusion of a Sensitive Climate System: A Stovetop Demonstration
(edited for clarity, 8:15 a.m.CDT April 10) Whether it is the Earth’s climate system experiencing warming, or a pot of water being placed on a warm stovetop, the fundamental basis of why the temperature of something changes is the same: If energy is being absorbed faster than it is being lost, then warming will result. This is illustrated in the following two plots, which show that imposing such a
Apr 09 2010
Update: Cloud Forcing Paper Finally Accepted to JGR
After about 2 years of multiple submissions and rewrites, our paper on the contaminating effect of natural, internally-forced global cloud variations on the diagnosis of climate feedbacks has finally been accepted by Journal of Geophysical Research. I do not yet have an estimated publication date, and please don’t ask for a pre-publication copy — I do not want to jeopardize its publication in any
Apr 05 2010
MARCH 2010 UAH Global Temperature Update: +0.65 deg. C
YR MON GLOBE NH SH TROPICS 2009 1 0.252 0.472 0.031 -0.065 2009 2 0.247 0.569 -0.074 -0.044 2009 3 0.191 0.326 0.056 -0.158 2009 4 0.162 0.310 0.013 0.012 2009 5 0.140 0.160 0.120 -0.057 2009 6 0.044 -0.011 0.100 0.112 2009 7 0.429 0.194 0.665 0.507 2009 8 0.242 0.229 0.254 0.407 2009 9 0.504 0.5
Mar 16 2010
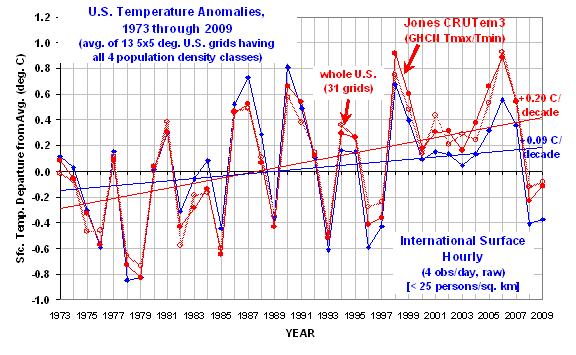
Direct Evidence that Most U.S. Warming Since 1973 Could Be Spurious
INTRODUCTION My last few posts have described a new method for quantifying the average Urban Heat Island (UHI) warming effect as a function of population density, using thousands of pairs of temperature measuring stations within 150 km of each other. The results supported previous work which had shown that UHI warming increases logarithmically with population, with the greatest rate of warming oc
Mar 11 2010
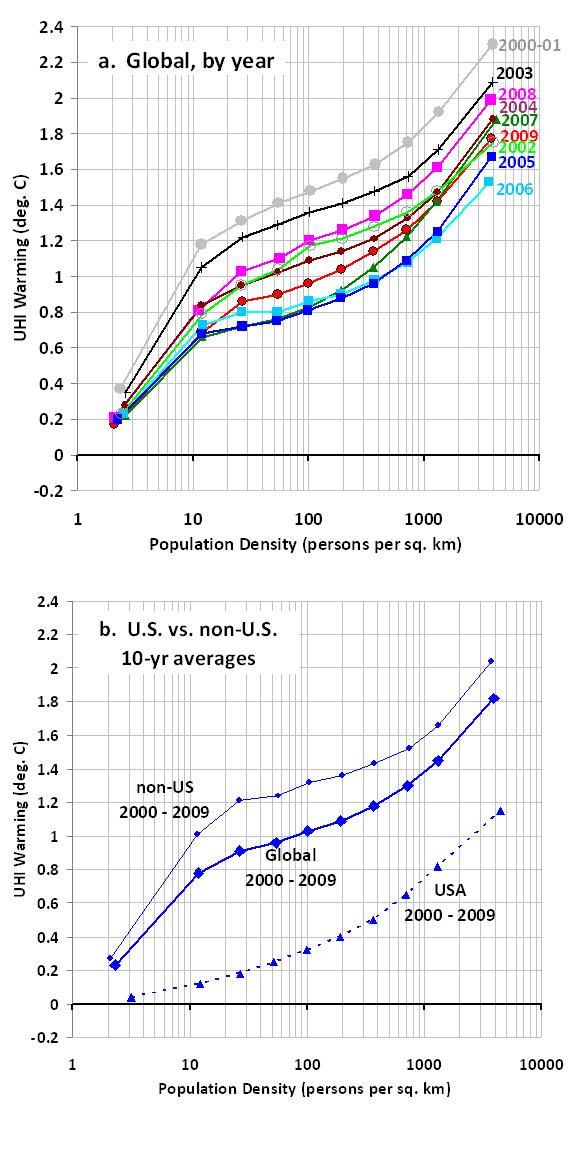
Urban Heat Island, a US-versus-Them Update
My post from yesterday showed a rather unexpected difference between the United States versus the rest of the world for the average urban heat island (UHI) temperature-population relationship. Updated results shown below have now reduced that discrepancy…but not removed it. I have now included more station temperature and population data by removing my requirement that two neighboring temperature
Mar 10 2010
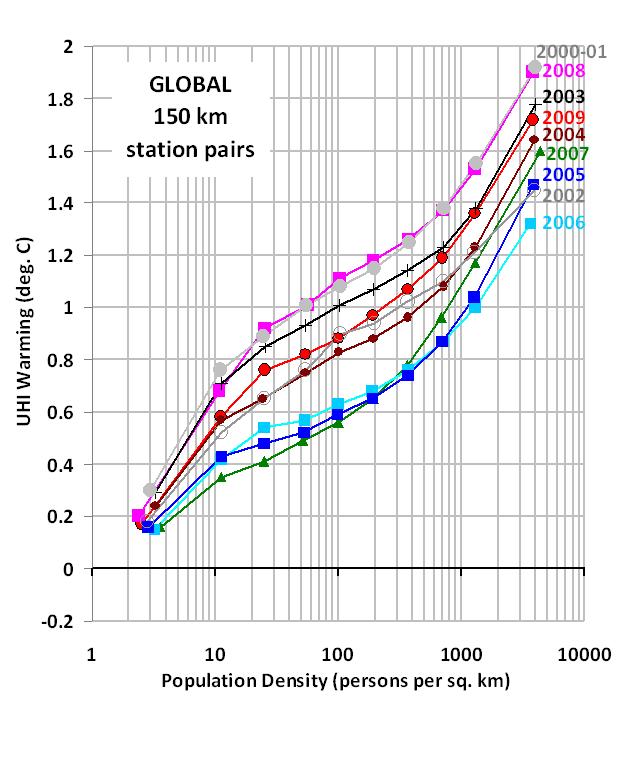
Global Urban Heat Island Effect Study: An Update
This is an update to my previous post describing a new technique for estimating the average amount of urban heat island (UHI) warming accompanying an increase in population density. The analysis is based upon 4x per day temperature observations in the NOAA International Surface Hourly (ISH) dataset, and on 1 km population density data for the year 2000. I’m providing a couple of charts with new
Mar 05 2010
February 2010 UAH Global Temperature Update: Version 5.3 Unveiled
UPDATED: 2:16 p.m. CST March 6, 2010: Added a plot of the differences between v5.3 and v5.2. YR MON GLOBE NH SH TROPICS 2009 1 0.213 0.418 0.009 -0.119 2009 2 0.220 0.557 -0.117 -0.091 2009 3 0.174 0.335 0.013 -0.198 2009 4 0.135 0.290 -0.020 -0.013 2009 5 0.102 0.109 0.094 -0.112 2009 6 0.022 -0.039 0.084 0.074 2009 7
Mar 03 2010
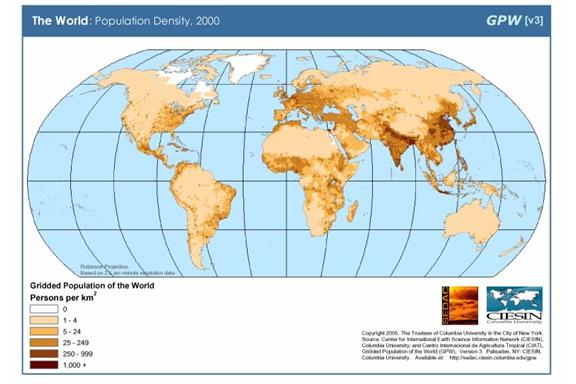
The Global Average Urban Heat Island Effect in 2000 Estimated from Station Temperatures and Population Density Data
UPDATE #1 (12:30 p.m. CST, March 3): Appended new discussion & plots showing importance of how low-population density stations are handled. UPDATE #2 (9:10 a.m. CST, March 4): Clarifications on methodology and answers to questions. ABSTRACT Global hourly surface temperature observations and 1 km resolution population density data for the year 2000 are used together to quantify the average urba
Feb 27 2010
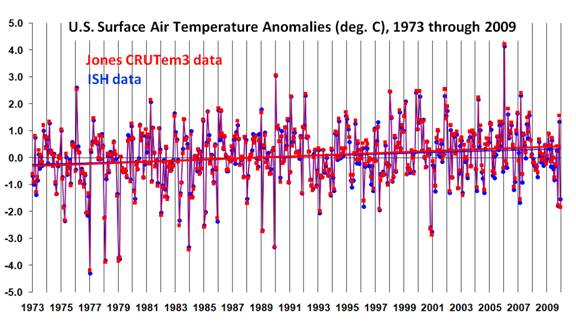
Spurious Warming in the Jones U.S. Temperatures Since 1973
INTRODUCTION As I discussed in my last post, I’m exploring the International Surface Hourly (ISH) weather data archived by NOAA to see how a simple reanalysis of original weather station temperature data compares to the Jones CRUTem3 land-based temperature dataset. While the Jones temperature analysis relies upon the GHCN network of ‘climate-approved’ stations whose number has been rapidly dwind
Feb 20 2010

New Work on the Recent Warming of Northern Hemispheric Land Areas
INTRODUCTION Arguably the most important data used for documenting global warming are surface station observations of temperature, with some stations providing records back 100 years or more. By far the most complete data available are for Northern Hemisphere land areas; the Southern Hemisphere is chronically short of data since it is mostly oceans. But few stations around the world have comp
Feb 09 2010
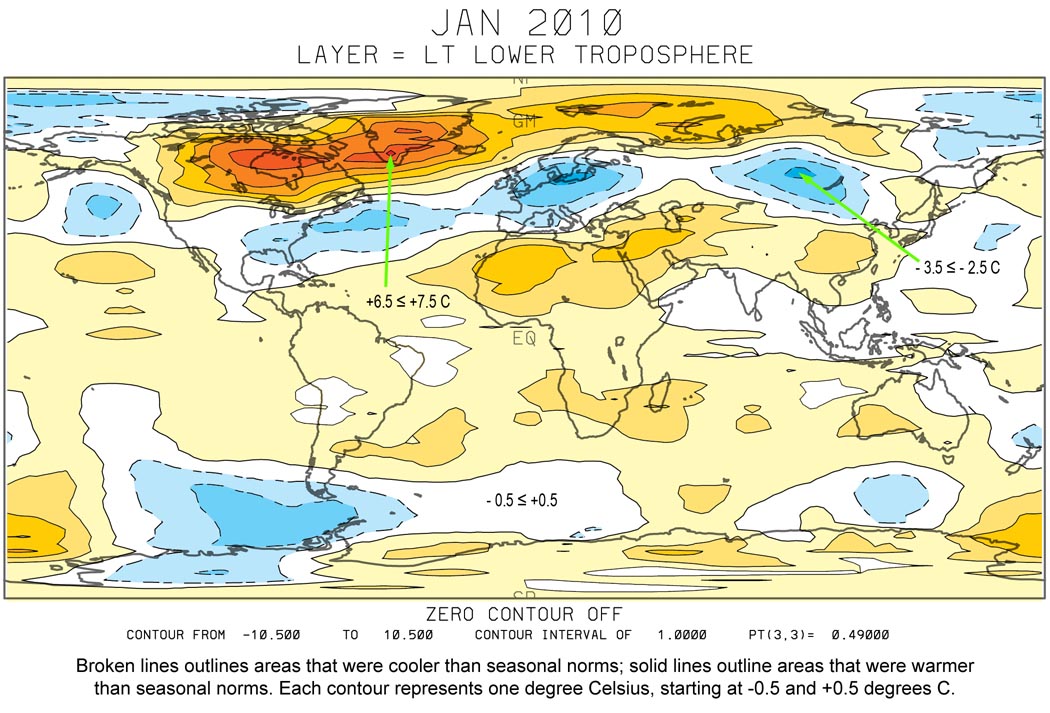
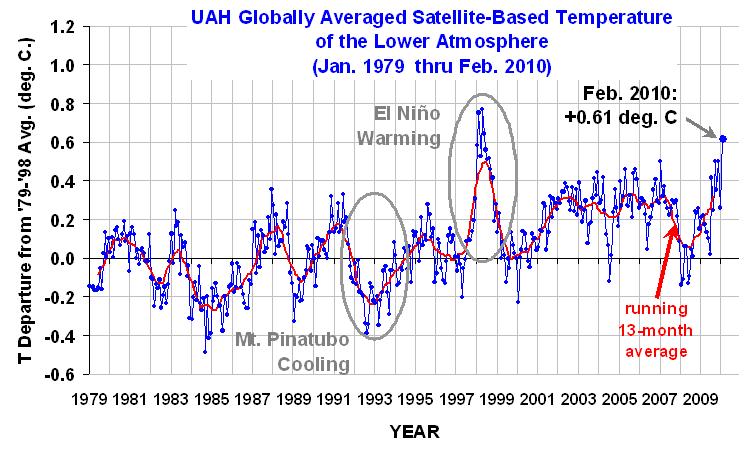
January 2010 Global Tropospheric Temperature Map
Here’s the UAH lower tropospheric temperature anomaly map for January, 2010. As can be seen, Northern Hemispheric land, on a whole, is not as cold as many of us thought (click on image for larger version). Below-normal areas were restricted to parts of Russia and China, most of Europe, and the southeastern United States. Most of Canada and Greenland were well above normal: It should also be re
Feb 08 2010
Some Thoughts on the Warm January, 2010
I continue to get lots of e-mails asking how global average tropospheric temperatures for January, 2010 could be at a record high (for January, anyway, in the 32 year satellite record) when it seems like it was such a cold January where people actually live. I followed up with a short sea surface temperature analysis from AMSR-E data which ended up being consistent with the AMSU tropospheric tem
Feb 04 2010
NASA Aqua Sea Surface Temperatures Support a Very Warm January, 2010
When I saw the “record” warmth of our UAH global-average lower tropospheric temperature (LT) product (warmest January in the 32-year satellite record), I figured I was in for a flurry of e-mails: “But this is the coldest winter I’ve seen since there were only 3 TV channels! How can it be a record warm January?” Sorry, folks, we don’t make the climate…we just report it. But, I will admit I was sur
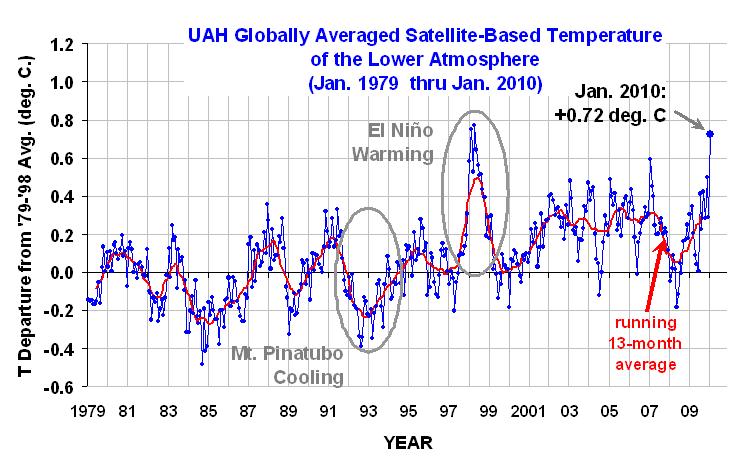
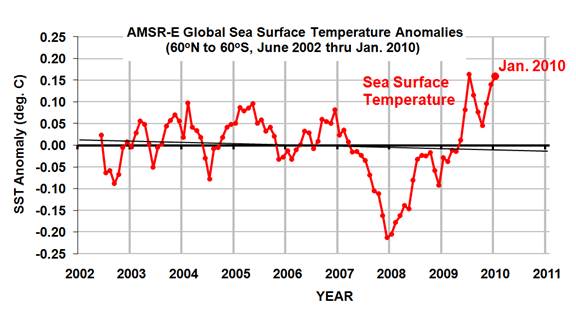
January 2010 UAH Global Temperature Update +0.72 Deg. C
UPDATE (4:00 p.m. Jan. 4): I’ve determined that the warm January 2010 anomaly IS consistent with AMSR-E sea surface temperatures from NASA’s Aqua satellite…I will post details later tonight or in the a.m. – Roy YR MON GLOBE NH SH TROPICS 2009 01 +0.304 +0.443 +0.165 -0.036 2009 02 +0.347 +0.678 +0.016 +0.051 2009 03 +0.206 +0.3
Jan 27 2010
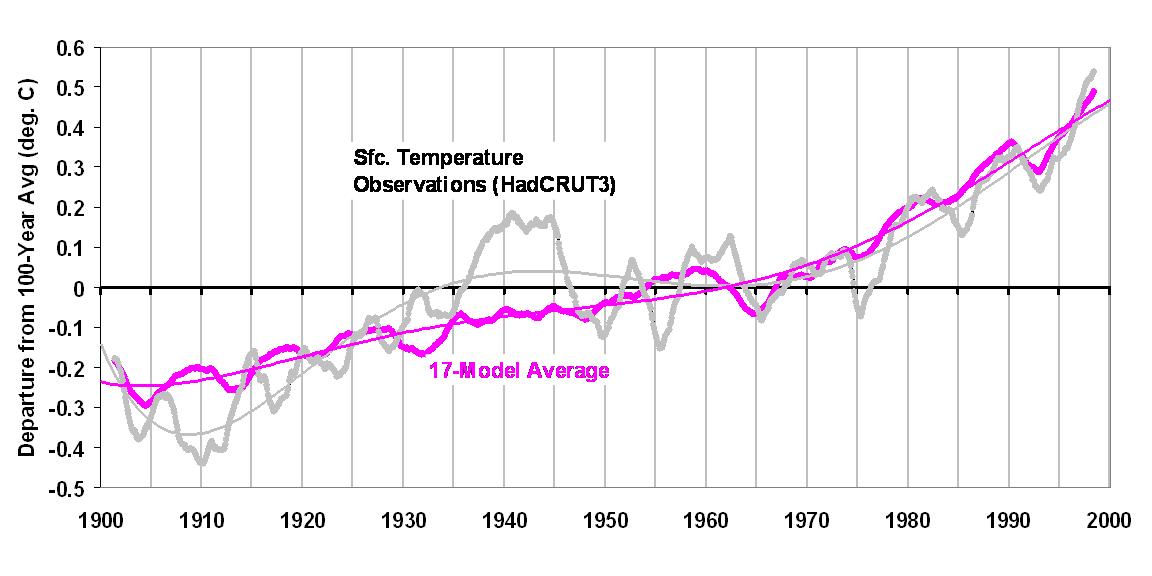
Evidence for Natural Climate Cycles in the IPCC Climate Models’ 20th Century Temperature Reconstructions
What can we learn from the IPCC climate models based upon their ability to reconstruct the global average surface temperature variations during the 20th Century? While the title of this article suggests I’ve found evidence of natural climate cycles in the IPCC models, it’s actually the temperature variability the models CANNOT explain that ends up being related to known climate cycles. After an
Jan 16 2010
Is Spencer Hiding the Increase? We Report, You Decide
One of the great things about the internet is people can post anything they want, no matter how stupid, and lots of people who are incapable of critical thought will simply accept it. I’m getting emails from people who have read blog postings accusing me of “hiding the increase” in global temperatures when I posted our most recent (Dec. 2009) global temperature update. In addition to the usual m
Jan 12 2010
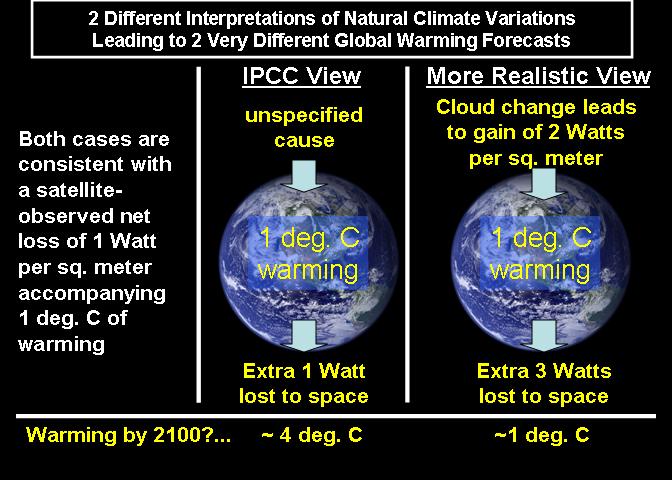
A Demonstration that Global Warming Predictions are Based More On Faith than On Science
I’m always searching for better and simpler ways to explain the reason why I believe climate researchers have overestimated the sensitivity of our climate system to increasing carbon dioxide concentrations in the atmosphere. What follows is a somewhat different take than I’ve used in the past. In the following cartoon, I’ve illustrated 2 different ways to interpret a hypothetical (but realistic)
Jan 09 2010
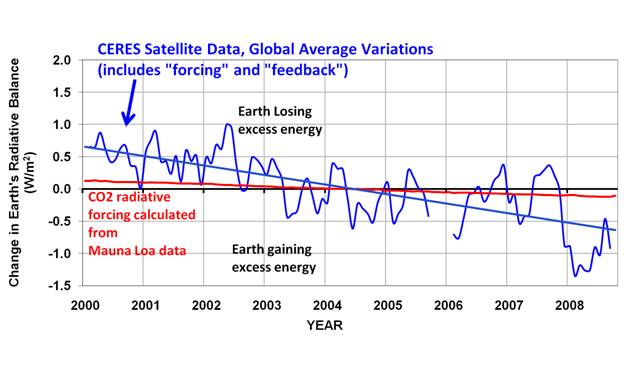
Clouds Dominate CO2 as a Climate Driver Since 2000
Last year I posted an analysis of satellite observations of the 2007-08 global cooling event, showing evidence that it was due to a natural increase in low cloud cover. Here I will look at the bigger picture of what how the satellite-observed variations in Earth’s radiative budget compare to that expected from increasing carbon dioxide. Is there something that we can say about the relative roles
Jan 06 2010
How the UAH Global Temperatures Are Produced
I am still receiving questions about the method by which the satellite microwave measurements are calibrated to get atmospheric temperatures. The confusion seems to have arisen because Christopher Monckton has claimed that our satellite data must be tied to the surface thermometer data, and after Climategate (as well all know) those traditional measurements have become suspect. So, time for a li
Jan 04 2010
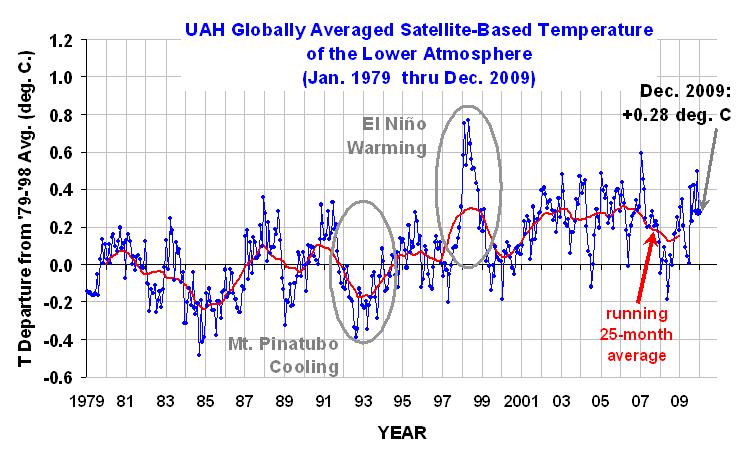
December 2009 UAH Global Temperature Update +0.28 Deg. C
YR MON GLOBE NH SH TROPICS 2009 1 +0.304 +0.443 +0.165 -0.036 2009 2 +0.347 +0.678 +0.016 +0.051 2009 3 +0.206 +0.310 +0.103 -0.149 2009 4 +0.090 +0.124 +0.056 -0.014 2009 5 +0.045 +0.046 +0.044 -0.166 2009 6 +0.003 +0.031 -0.025 -0.003 2009 7
Dec 31 2009
What If There Was No Greenhouse Effect?
(edited 1 p.m. Dec. 31, 2009, to mention latent heat release) The climate of the Earth is profoundly affected by two competing processes: the greenhouse effect, which acts to warm the lower atmosphere and cool the upper atmosphere, and atmospheric convection (thermals, clouds, precipitation) which does just the opposite: cools the lower atmosphere and warms the upper atmosphere. To better unders
Dec 30 2009

EcoFreako: The Al Gore Tribute Band
Most people don’t realize that Al Gore invented rock & roll music. Really…they don’t. Mr. Gore even had his own tour — called Live Earth — where he and his band, CO2 Fighters, rocked the house in London on July 7, 2007. Al Gore and his band, CO2 Fighters, rock Wembley Stadium in London as part of Live Earth. You might remember Live Earth. It was a worldwide string of concerts which frivolo
Dec 20 2009
American Thinker: A Climatology Conspiracy?
The following article appears today in American Thinker, by David Douglass and John Christy, which tells their story of how scientists involved in Climategate did their best to protect the IPCC global warming party line through manipulation of the peer review process: A Climatology Conspiracy? by David H. Douglass and John R. Christy “The CRU emails have revealed how the normal conventions of the
Dec 16 2009
Little Feedback on Climate Feedbacks in the City by the Bay
The Fall meeting of the American Geophysical Union (AGU) here in San Francisco this week is amazing for it’s sheer size: many thousands of Earth scientists presenting talks and posters on just about every Earth science subject imaginable. Today was my chance to try to convince other scientists who work on the critical issue of feedbacks in the climate system that some fundamental mistakes have bee
Dec 13 2009
Cloud Feedback Presentation for Fall 2009 AGU Meeting
UPDATED 12/16/09 1415 PST with final pdf version of talk…and press release, 1425 PST. I decided to make my invited presentation on estimating cloud feedbacks from satellite measurements available here (final version-pdf):Spencer-Forcing-Feedback-AGU-09-San-Francisco-final. There will be a UAH press release on Wednesday, December 16, which is embargoed until 11 a.m. PST (1 p.m. CST). UAHuntsville
Dec 10 2009
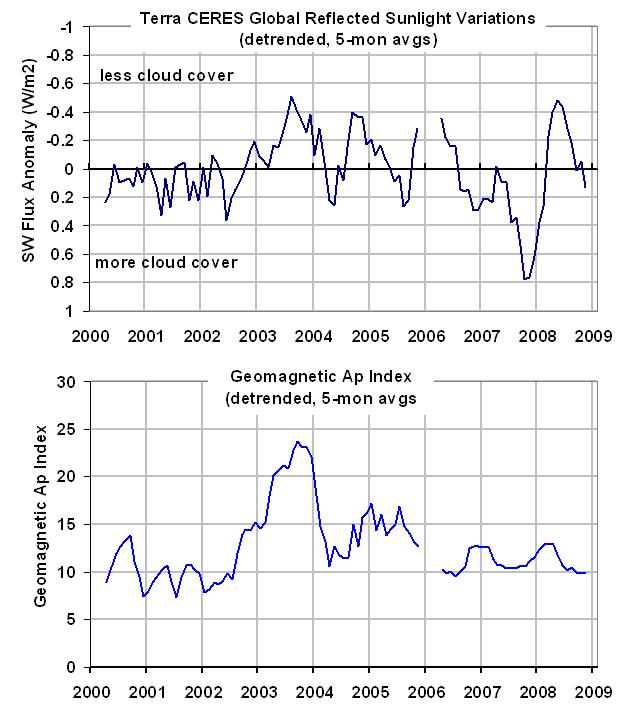
Geomagnetic Forcing of Earth’s Cloud Cover During 2000-2008?
I’ll admit to being a skeptic when it comes to other skeptics’ opinions on the potential effects of sunspot activity on climate. Oh, it’s all very possible I suppose, but I’ve always said I’ll start believing it when someone shows a quantitative connection between variations in global cloud cover (not temperature) and geomagnetic activity. Maybe my skepticism is because I never took astronomy i
Dec 09 2009
Global Warming Skepticism 101
(last updated 9:05 a.m. 9 December 2009). I get so many questions from readers about a variety of global warming issues that I thought I would whip up some Q&A for those who want to understand the views of skeptics a little better. I will try to update these with links and additional answers as time permits. Climate science is complex and the study of it is highly specialized. Nevertheless,
Dec 06 2009
What If Climategate was Cancergate?
Senator Barbara Boxer has said that the e-mails supposedly stolen from a computer at the Climatic Research Unit in the UK should lead to prosecution of the hacker who did it. This rather obvious attempt to divert attention from the content of the emails, to the manner in which the e-mails were obtained, led my wife to make an interesting observation. What if the intercepted emails uncovered medic
Can Global Warming Predictions be Tested with Observations of the Real Climate System?
In a little over a week I will be giving an invited paper at the Fall meeting of the American Geophysical Union (AGU) in San Francisco, in a special session devoted to feedbacks in the climate system. If you don’t already know, feedbacks are what will determine whether anthropogenic global warming is strong or weak, with cloud feedbacks being the most uncertain of all. In the 12 minutes I have
Dec 05 2009
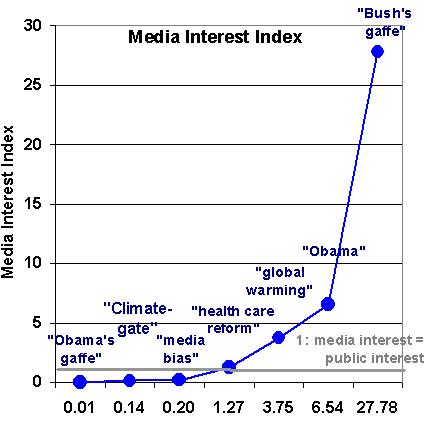
How Climategate Ranks in a Media Interest Index
The lack of coverage of Climategate by the mainstream news media over the last 2 weeks has been breathtaking. Richard North at the EUReferendum blog advanced a way to measure media bias of this kind with what he calls his “Tiger Woods Index”, where he compares the number of Google search web matches to Google search news matches. The idea is that if the media are avoiding an issue, then the numb
Dec 04 2009
Climategate II: Revenge of the Climate Modelers
It has been two weeks since Climategate revealed that some of the IPCC’s leading researchers have conspired to manipulate temperature data, hide data from other researchers, and bully those scientists who do not agree with them by interfering with the peer review process. (If you haven’t heard about Climategate, it might be because you are still watching ABC, CBS, or NBC. Google ‘Climategate’,
Dec 02 2009
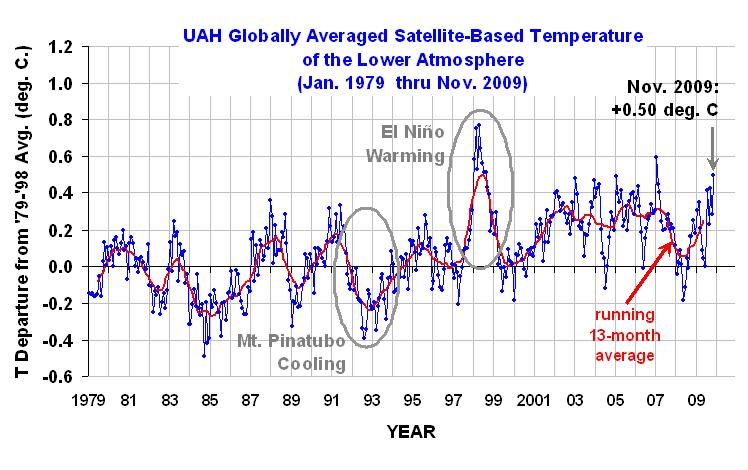
November 2009 UAH Global Temperature Update +0.50 deg. C
YR MON GLOBE NH SH TROPICS 2009 1 +0.304 +0.443 +0.165 -0.036 2009 2 +0.347 +0.678 +0.016 +0.051 2009 3 +0.206 +0.310 +0.103 -0.149 2009 4 +0.090 +0.124 +0.056 -0.014 2009 5 +0.045 +0.046 +0.044 -0.166 2009 6 +0.003 +0.031 -0.025 -0.003 2009 7
Nov 28 2009
My Top 10 Annoyances in the Climate Change Debate
Well, maybe not my top 10…but the first ten that I thought of. 1. The term “climate change” itself. Thirty years ago, the term “climate change” would have meant natural climate change, which is what climate scientists mostly studied before that time. Today, it has come to mean human-caused climate change. The public, and especially the media, now think that “climate change” implies WE are resp
Nov 21 2009
ClimateGate and the Elitist Roots of Global Warming Alarmism
The hundreds of e-mails being made public after someone hacked into Phil Jones’ Climatic Research Unit (CRU) computer system offer a revealing peek inside the IPCC machine. It will take some time before we know whether any illegal activity has been uncovered (e.g. hiding or destruction of data to avoid Freedom of Information Act inquiries). Some commentators even think this is the beginning of
Nov 20 2009
Global Warming’s Blue Dress Moment? The CRU EMail Hack Scandal
The recent hacking of the University of East Anglia’s Climatic Research Unit (CRU) computer system has led to the release of hundreds, if not thousands, of e-mails which — if real — reveal the tactics and motivations of some of the top Intergovernmental Panel on Climate Change (IPCC) scientists. I hesitate to name names, but there are several websites now buzzing with all of the details and sampl
Nov 06 2009
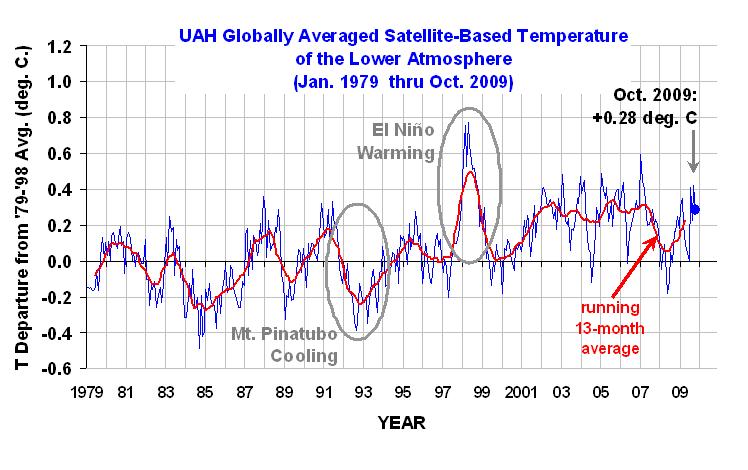
October 2009 UAH Global Temperature Update +0.28 deg. C
YR MON GLOBE NH SH TROPICS 2009 1 +0.304 +0.443 +0.165 -0.036 2009 2 +0.347 +0.678 +0.016 +0.051 2009 3 +0.206 +0.310 +0.103 -0.149 2009 4 +0.090 +0.124 +0.056 -0.014 2009 5 +0.045 +0.046 +0.044 -0.166 2009 6 +0.003 +0.031 -0.025 -0.003 2009 7
Nov 02 2009
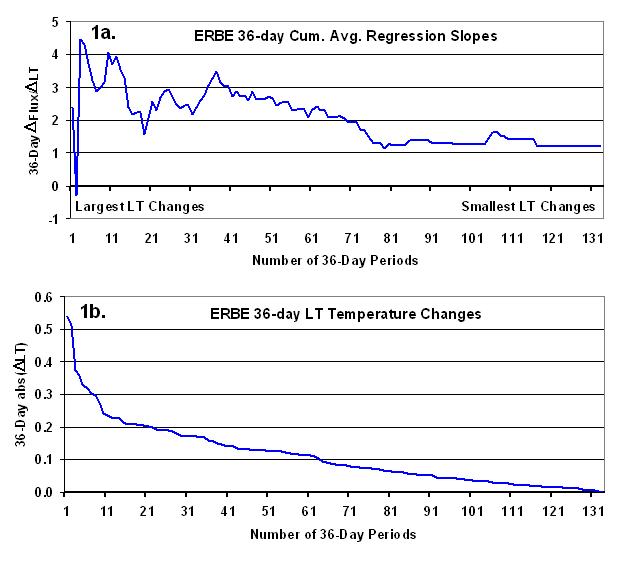
Some Comments on the Lindzen and Choi (2009) Feedback Study
I keep getting requests to comment on the recent GRL paper by Lindzen and Choi (2009), who computed how satellite-measured net (solar + infrared) radiation in the tropics varied with surface temperature changes over the 15 year period of record of the Earth Radiation Budget Satellite (ERBS, 1985-1999). The ERBS satellite carried the Earth Radiation Budget Experiment (ERBE) which provided our fir
Nov 01 2009
In Their Own Words: The IPCC on Climate Feedbacks
Despite the fact that the magnitude of anthropogenic global warming depends mostly upon the strengths of feedbacks in the climate system, there is no known way to actually measure those feedbacks from observational data. The IPCC has admitted as much on p. 640 of the IPCC AR4 report, at the end of section 8.6, which is entitled “Climate Sensitivity and Feedbacks”: “A number of diagnostic tests h


No comments:
Post a Comment